2004 Presidential General Election Data - Louisiana
Note: The Google advertisement links below may advocate political positions that this site does not endorse.
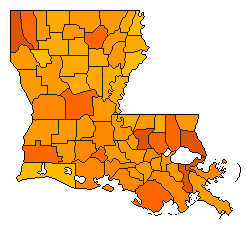
by Parish

 County Map  Pop Map
ParishPopulationTotal VoteBKMargin %MarginBushKerryOther
           
Acadia59,16825,230127,14628.32% 63.75% 35.42% 0.83%
Allen25,4079,124121,34914.79% 56.33% 41.55% 2.12%
Ascension87,16439,1001210,70627.38% 63.07% 35.69% 1.24%
Assumption23,23410,735216195.77% 46.26% 52.03% 1.71%
Avoyelles41,98115,525121,3268.54% 53.48% 44.93% 1.59%
Beauregard34,09413,281125,80443.70% 71.30% 27.60% 1.09%
Bienville15,3617,157122132.98% 50.47% 47.49% 2.04%
Bossier104,08042,7051217,72341.50% 70.34% 28.84% 0.81%
Caddo251,506106,595122,5532.40% 50.93% 48.54% 0.53%
Calcasieu184,96179,6981213,21116.58% 57.81% 41.24% 0.95%
Caldwell10,8374,752121,92440.49% 69.61% 29.12% 1.26%
Cameron9,6814,640121,82339.29% 68.75% 29.46% 1.79%
Catahoula10,6274,954121,54631.21% 64.98% 33.77% 1.25%
Claiborne16,4716,6301285012.82% 55.87% 43.05% 1.09%
Concordia19,7248,980121,98122.06% 60.43% 38.37% 1.19%
De Soto26,23111,336121,18510.45% 54.79% 44.34% 0.87%
East Baton Rouge412,633183,6421217,6459.61% 54.42% 44.81% 0.76%
East Carroll8,9543,3952162318.35% 39.97% 58.32% 1.71%
East Feliciana20,9509,2011293010.11% 54.57% 44.46% 0.97%
Evangeline35,45113,979122,19215.68% 56.86% 41.18% 1.95%
Franklin20,8129,103123,31336.39% 67.46% 31.07% 1.47%
Grant19,1397,991123,93449.23% 73.97% 24.74% 1.29%
Iberia74,44932,273126,99421.67% 60.17% 38.50% 1.32%
Iberville32,49714,827211,92612.99% 42.71% 55.70% 1.58%
Jackson15,2787,647122,51332.86% 65.88% 33.02% 1.10%
Jefferson453,590191,6631245,74623.87% 61.50% 37.64% 0.86%
Jefferson Davis31,23513,007123,31025.45% 61.93% 36.48% 1.59%
Lafayette195,70789,9231226,52229.49% 64.20% 34.71% 1.09%
Lafourche92,15737,864128,31721.97% 60.04% 38.08% 1.88%
La Salle14,1616,238123,86061.88% 80.39% 18.52% 1.09%
Lincoln42,38218,218123,54919.48% 59.23% 39.75% 1.02%
Livingston105,65344,2531224,08154.42% 76.78% 22.36% 0.86%
Madison12,9964,67321430.92% 49.03% 49.95% 1.03%
Morehouse30,55112,971122,13516.46% 57.60% 41.14% 1.26%
Natchitoches38,74116,966121,86310.98% 54.59% 43.60% 1.81%
Orleans462,269197,10321109,76355.69% 21.74% 77.43% 0.84%
Ouachita148,35564,4441219,73430.62% 64.78% 34.16% 1.05%
Plaquemines28,96912,153123,68530.32% 64.72% 34.40% 0.87%
Pointe Coupee22,53711,271212832.51% 48.17% 50.68% 1.15%
Rapides128,01354,0691215,58828.83% 63.79% 34.96% 1.24%
Red River9,6064,717123677.78% 53.15% 45.37% 1.48%
Richland20,4858,665122,38927.57% 63.14% 35.57% 1.29%
Sabine23,6169,576123,96841.44% 70.08% 28.64% 1.27%
St. Bernard65,55429,838129,64132.31% 65.68% 33.37% 0.96%
St. Charles50,07323,837125,89124.71% 61.87% 37.15% 0.98%
St. Helena10,3095,5082193817.03% 40.58% 57.61% 1.82%
St. James21,14611,108211,86216.76% 40.92% 57.68% 1.40%
St. John the Baptist45,58119,617211,2666.45% 46.08% 52.53% 1.39%
St. Landry89,63536,760121490.41% 49.82% 49.42% 0.76%
St. Martin50,45322,824121,7747.77% 52.99% 45.22% 1.79%
St. Mary52,18922,694123,33014.67% 56.74% 42.07% 1.19%
St. Tammany213,553100,5921250,47450.18% 74.70% 24.52% 0.78%
Tangipahoa105,15842,1351210,83625.72% 62.14% 36.42% 1.45%
Tensas6,1762,96321160.54% 49.04% 49.58% 1.38%
Terrebonne106,52340,5741212,67431.24% 64.96% 33.73% 1.31%
Union22,89410,718124,36840.75% 69.57% 28.82% 1.60%
Vermilion54,75124,552125,98424.37% 61.38% 37.00% 1.62%
Vernon49,54515,229126,99745.95% 72.44% 26.50% 1.06%
Washington44,16117,841124,45224.95% 61.69% 36.74% 1.58%
Webster41,25418,449124,23722.97% 60.00% 37.04% 2.96%
West Baton Rouge21,88010,835128908.21% 53.73% 45.52% 0.75%
West Carroll11,9635,033122,50949.85% 74.31% 24.46% 1.23%
West Feliciana15,1085,2181271813.76% 56.19% 42.43% 1.38%
Winn16,1516,507122,31035.50% 67.10% 31.60% 1.31%
Total4,515,7701,943,10612281,87014.51% 56.72% 42.22% 1.06%
Enable

Purchase Data in Spreadsheet

Customize Table:
Enable Columns Not Shown
Voting Age Population
Voting Age Citizens
Registered Voters
Total Ballots Cast
Total Invalid Ballots (Under/Over-Votes)
Percent Invalid Ballots (Under/Over-Votes)
Voter Turnout (Vote for President as a % Voting Age Population)
Voter Turnout (Vote for President as a % Voting Age Citizens)
Voter Turnout (Vote for President as a % Registered Voters)
Swing Percentage
Trend Percentage
Popular Vote

Minimum Candidate Percentage to Display Individual Percent Column (m)
Minimum Candidate Percentage to Display Individual Popular Vote Column (m)

Sort Data:

Sort Direction: Ascending Descending


Sources:
  • Source for Popular Vote Parish data: Louisiana Secretary of State. Elections Division. Louisiana Secretary of State Election Results by Parish-Official Results for Election Date: 11/02/04 Presidential Electors, Louisiana Secretary of State. Elections Division (http://) (accessed 20 Nov 2004)

2004 National Population Data Table by State - Louisiana Results for 2004

Login

Terms of Use - DCMA Policy - Privacy Policy and Cookies


© Dave Leip's Atlas of U.S. Elections, LLC 2019 All Rights Reserved