Home
2024
Election Results
Election Info
Weblog
Forum
Wiki
Search
Email
Login
Site Info
Store
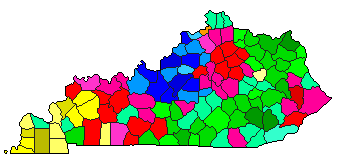
1979 Gubernatorial Democratic Primary Election Results - Kentucky
Note: The Google advertisement links below may advocate political positions that this site does not endorse.
Data for this Contest was Contributed by on 2009-03-08
Gubernatorial
Candidate
Political
Party
Popular Vote
John Y. Brown, Jr.
Democratic
165,188
29.14%
Harvey Sloane
Democratic
139,713
24.65%
Terry McBrayer
Democratic
131,530
23.21%
Carroll Hubbard, Jr.
Democratic
68,577
12.10%
Thelma L. Stovall
Democratic
47,633
8.40%
Lyle L. Willis
Democratic
5,349
0.94%
George Atkins
Democratic
3,810
0.67%
Doris Shuja Binion
Democratic
2,580
0.46%
John J. Weikel
Democratic
2,436
0.43%
Map Key
> 20%
> 30%
> 40%
> 50%
> 60%
> 70%
Turnout
Maps
Pop. (m)
Demographic Data
1980 Population:
3,660,324
Enum.
1980 Population Density:
35.6
persons/km
2
1979 Population:
0
Est.
1979 Population Density:
0.0
persons/km
2
1970 Population:
3,220,711
Enum.
1970 Population Density:
31.3
persons/km
2
Land Area (2000):
102,896
km
2
Annual Pop Growth Rate:
1.3
%
Election Data and Statistics:
County Data (Table)
(m)
County Data (Graphs)
Purchase Detailed Data
Compare State Maps by Year
View All 1979 Kentucky Maps
Election Tools
Atlas Forum
Image Code for Maps:
County
,
Pop
Data Sources:
Source for Popular Vote data: Kentucky State Board of Elections.
Primary Election, May 29, 1979
, Kentucky State Board of Elections (http://elect.ky.gov/NR/rdonlyres/50D4171E-47AA-4D78-BAE6-1846546C15A4/0/gov_ltgov.txt) (accessed 01 Feb 2007)
Source for Population data: U.S. Census Bureau.
Results for and Individual County:
(m)
Choose Year
2019
2015
2007
2003
1995
1991
1987
1983
1975
Choose Office
Lt. Governor
Secretary of State
State Auditor
Agriculture Commissioner
Choose State
Kentucky Election Results Home
-
National Results for 1979
-
Use Frame Navigation
Login
Terms of Use
-
DCMA Policy
-
Privacy Policy and Cookies
©
Dave Leip's Atlas of U.S. Elections, LLC 2019 All Rights Reserved


