Home
2024
Election Results
Election Info
Weblog
Forum
Wiki
Search
Email
Login
Site Info
Store
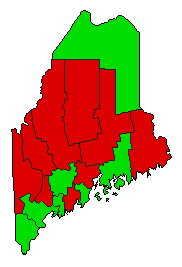
1995 Referendum Special Election Results - Maine
Note: The Google advertisement links below may advocate political positions that this site does not endorse.
Data for this Contest was Contributed by on 2007-04-03
Referendum: Question #8 (Seat Belts)
Popular Vote
Yes
208,164
50.39%
No
204,928
49.61%
Map Key
> 40%
> 50%
> 60%
> 70%
Turnout
Maps
Pop. (m)
Election Notes:
Question #8: "Do you favor requiring all persons to use safety belts in motor vehicles?"
Demographic Data
2000 Population:
1,274,923
Enum.
2000 Population Density:
16.0
persons/km
2
1995 Population:
1,243,480
Est.
1995 Population Density:
15.6
persons/km
2
1990 Population:
1,227,928
Enum.
1990 Population Density:
15.4
persons/km
2
Land Area (2000):
79,931
km
2
Annual Pop Growth Rate:
0.4
%
Election Data and Statistics:
County Data (Table)
(m)
County Data (Graphs)
Purchase Detailed Data
Compare State Maps by Year
View All 1995 Maine Maps
Election Tools
Atlas Forum
Image Code for Maps:
County
,
Pop
Data Sources:
Source for Popular Vote data: Maine Secretary of State.
Referendum Election Results - November 7, 1995
, Maine Secretary of State (http://www.maine.gov/sos/cec/elec/1995r/reftot95.htm) (accessed 03 Apr 2007)
Source for Population data: U.S. Census Bureau.
Results for and Individual County:
(m)
Choose Year
2018
2003
Choose Office
Choose State
Texas
Texas
Maine Election Results Home
-
National Results for 1995
-
Use Frame Navigation
Login
Terms of Use
-
DCMA Policy
-
Privacy Policy and Cookies
©
Dave Leip's Atlas of U.S. Elections, LLC 2019 All Rights Reserved


