Home
2024
Election Results
Election Info
Weblog
Forum
Wiki
Search
Email
Login
Site Info
Store
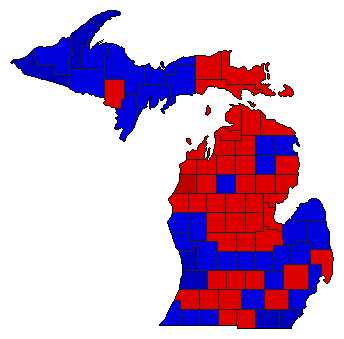
1996 Senatorial Republican Primary Election Results - Michigan
Note: The Google advertisement links below may advocate political positions that this site does not endorse.
Data for this Contest was Contributed by on 2012-02-29
Senatorial
Candidate
Political
Party
Popular Vote
Ronna Romney
Republican
355,583
52.07%
Jim Nicholson
Republican
326,835
47.86%
Write-ins
-
447
0.07%
Map Key
> 40%
> 50%
> 60%
> 70%
Turnout
Maps
Pop. (m)
Demographic Data
2000 Population:
9,938,444
Enum.
2000 Population Density:
67.6
persons/km
2
1996 Population:
9,758,645
Est.
1996 Population Density:
66.3
persons/km
2
1990 Population:
9,295,287
Enum.
1990 Population Density:
63.2
persons/km
2
Land Area (2000):
147,121
km
2
Annual Pop Growth Rate:
0.7
%
Election Data and Statistics:
County Data (Table)
(m)
County Data (Graphs)
Purchase Detailed Data
Compare State Maps by Year
View All 1996 Michigan Maps
Election Tools
Atlas Forum
Image Code for Maps:
County
,
Pop
Data Sources:
Source for Popular Vote data: Michigan Department of State.
1996 Primary Election Results for August 6
, Michigan Department of State (http://www.mi.gov/documents/1996_Primary_Election_Results_for_August_6,_1996_20872_7.pdf) (accessed 29 Feb 2012)
Source for Population data: U.S. Census Bureau.
Results for and Individual County:
(m)
Choose Year
2018
2012
2006
Choose Office
President
Choose State
Alabama
Colorado
Georgia
Illinois
Iowa
Kansas
Maine
Nebraska
Oregon
South Carolina
Texas
Wyoming
Michigan Election Results Home
-
National Results for 1996
-
Use Frame Navigation
Login
Terms of Use
-
DCMA Policy
-
Privacy Policy and Cookies
©
Dave Leip's Atlas of U.S. Elections, LLC 2019 All Rights Reserved


