Home
2024
Election Results
Election Info
Weblog
Forum
Wiki
Search
Email
Login
Site Info
Store
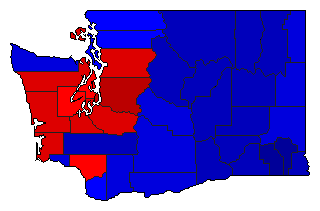
2000 Controller General Election Results - Washington
Note: The Google advertisement links below may advocate political positions that this site does not endorse.
Data for this Contest was Contributed by on 2009-05-04
Controller
Candidate
Political
Party
Popular Vote
Al Gore
Democratic
1,247,652
50.16%
George W. Bush
Republican
1,108,864
44.58%
Ralph Nader
Green
103,002
4.14%
Harry Browne
Libertarian
13,135
0.53%
Patrick Buchanan
Reform
7,171
0.29%
Other (
+
)
-
7,609
0.31%
Map Key
> 40%
> 50%
> 60%
> 70%
Turnout
Maps
Demographic Data
2000 Population:
5,894,121
Enum.
2000 Population Density:
34.2
persons/km
2
1990 Population:
4,866,669
Enum.
1990 Population Density:
28.2
persons/km
2
Land Area (2000):
172,348
km
2
Annual Pop Growth Rate:
1.9
%
Election Data and Statistics:
County Data (Table)
(m)
County Data (Graphs)
Precinct Data
(m)
Precinct Data Search
(m)
Purchase Detailed Data
Compare State Data by Year (Table)
Compare State Data by Year (Graphs)
View All 2000 Washington Data
Compare State Maps by Year
View All 2000 Washington Maps
Election Tools
Atlas Forum
Image Code for Maps:
County
,
Pop
,
Prc
Data Sources:
Source for Popular Vote data: Washington Secretary of State.
2000 General Election
, Washington Secretary of State (http://sos.wa.gov/) (accessed 03 Dec 2006)
Source for Population data: U.S. Census Bureau.
Results for and Individual County:
Adams County
Asotin County
Benton County
Chelan County
Clallam County
Clark County
Columbia County
Cowlitz County
Douglas County
Ferry County
Franklin County
Garfield County
Grant County
Grays Harbor County
Island County
Jefferson County
King County
Kitsap County
Kittitas County
Klickitat County
Lewis County
Lincoln County
Mason County
Okanogan County
Pacific County
Pend Oreille County
Pierce County
San Juan County
Skagit County
Skamania County
Snohomish County
Spokane County
Stevens County
Thurston County
Wahkiakum County
Walla Walla County
Whatcom County
Whitman County
Yakima County
Choose Year
2020
2012
2004
1996
1992
Choose Office
President
Senator
Governor
Lt. Governor
Secretary of State
State Treasurer
Attorney General
Comptroller General
State Auditor
Insurance Commissioner
Initiative to the People 713
Initiative to the People 722
Initiative to the People 728
Initiative to the People 729
Initiative to the People 732
Initiative to the People 745
Choose State
Washington Election Results Home
-
National Results for 2000
-
Use Frame Navigation
Login
Terms of Use
-
DCMA Policy
-
Privacy Policy and Cookies
©
Dave Leip's Atlas of U.S. Elections, LLC 2019 All Rights Reserved


