Home
2024
Election Results
Election Info
Weblog
Forum
Wiki
Search
Email
Login
Site Info
Store
1990 Attorney General General Election Results - Kansas
Note: The Google advertisement links below may advocate political positions that this site does not endorse.
Data for this Contest was Contributed by on 2007-02-01
Attorney General
Candidate
Political
Party
Popular Vote
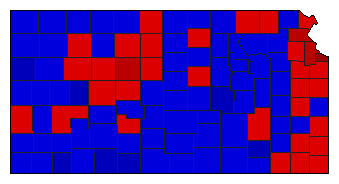
Bob Stephan
Republican
386,989
50.28%
Bert Cantwell
Democratic
382,691
49.72%
Map Key
> 40%
> 50%
> 60%
> 70%
Turnout
Maps
Pop. (m)
Demographic Data
1990 Population:
2,477,588
Enum.
1990 Population Density:
11.7
persons/km
2
1980 Population:
2,364,236
Enum.
1980 Population Density:
11.2
persons/km
2
Land Area (2000):
211,900
km
2
Annual Pop Growth Rate:
0.5
%
Election Data and Statistics:
County Data (Table)
(m)
County Data (Graphs)
Purchase Detailed Data
Compare State Data by Year (Table)
Compare State Data by Year (Graphs)
View All 1990 Kansas Data
Compare State Maps by Year
View All 1990 Kansas Maps
Election Tools
Atlas Forum
Image Code for Maps:
County
,
Pop
Data Sources:
Source for Popular Vote data: Kansas Secretary of State.
Official Returns
, Kansas Secretary of State (http://www.kssos.org/elections/elmpast/90genral.exe) (accessed 01 Feb 2007)
Source for Population data: U.S. Census Bureau.
Results for and Individual County:
(m)
Choose Year
2022
2018
2014
2010
2006
2002
1998
1994
1986
1982
1978
1974
1972
1970
1968
1966
1964
1962
1960
1958
1956
1954
1952
1950
1914
1912
1910
Choose Office
Senator
Governor
Secretary of State
State Treasurer
Insurance Commissioner
Choose State
Alabama
Arizona
California
Colorado
Connecticut
Delaware
Georgia
Idaho
Illinois
Iowa
Maryland
Massachusetts
Minnesota
Nebraska
Nevada
New Mexico
Ohio
Rhode Island
South Dakota
Texas
Wisconsin
2022 >
Kansas Election Results Home
-
National Results for 1990
-
Use Frame Navigation
Login
Terms of Use
-
DCMA Policy
-
Privacy Policy and Cookies
©
Dave Leip's Atlas of U.S. Elections, LLC 2019 All Rights Reserved


