Home
2024
Election Results
Election Info
Weblog
Forum
Wiki
Search
Email
Login
Site Info
Store
1993 Gubernatorial General Election Results - New Jersey
Note: The Google advertisement links below may advocate political positions that this site does not endorse.
Gubernatorial
Candidate
Lt. Gubernatorial
Candidate
Political
Party
Popular Vote
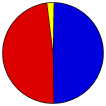
Christine Todd Whitman
-
Republican
1,236,124
49.33%
James Florio
-
Democratic
1,210,031
48.29%
Pat Daly
-
Independent
10,071
0.40%
Kenneth R. Kaplan
-
Independent
7,935
0.32%
Other (
+
)
-
-
41,803
1.67%
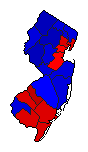
Map Key
> 40%
> 50%
> 60%
> 70%
Turnout
Maps
Pop. (m)
Rep. (m)
Dem. (m)
Demographic Data
2000 Population:
8,414,350
Enum.
2000 Population Density:
438.0
persons/km
2
1993 Population:
7,948,915
Est.
1993 Population Density:
413.8
persons/km
2
1990 Population:
7,747,750
Enum.
1990 Population Density:
403.3
persons/km
2
Land Area (2000):
19,211
km
2
Annual Pop Growth Rate:
0.8
%
Election Data and Statistics:
County Data (Table)
(m)
County Data (Graphs)
Purchase Detailed Data
Compare State Data by Year (Table)
Compare State Data by Year (Graphs)
View All 1993 New Jersey Data
Compare State Maps by Year
View All 1993 New Jersey Maps
Election Tools
Atlas Forum
Image Code for Maps:
County
,
Pop
Data Sources:
Source for Popular Vote data: New Jersey Department of Law and Public Safety. Division of Elections,
Official List Gubernatorial General Election Returns by County For Election Held November 2, 1993
(Trenton, 1993)
Source for Population data: U.S. Census Bureau.
Results for and Individual County:
(m)
Choose Year
2021
2017
2013
2009
2005
2001
1997
1989
1985
1981
1977
1973
1969
1965
1961
1957
1953
1949
1937
1934
1931
1928
1925
1907
1904
1901
1898
1895
1892
1889
1874
Choose Office
Choose State
Virginia
1997 >
New Jersey Election Results Home
-
National Results for 1993
-
Use Frame Navigation
Login
Terms of Use
-
DCMA Policy
-
Privacy Policy and Cookies
©
Dave Leip's Atlas of U.S. Elections, LLC 2019 All Rights Reserved


