Home
2024
Election Results
Election Info
Weblog
Forum
Wiki
Search
Email
Login
Site Info
Store
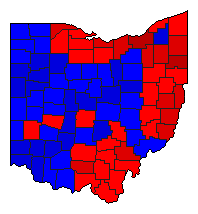
1996 Presidential General Election Results - Ohio
Note: The Google advertisement links below may advocate political positions that this site does not endorse.
Presidential
Candidate
Vice Presidential
Candidate
Political
Party
Popular Vote
Electoral Vote
William Clinton
Albert Gore Jr.
Democratic
2,148,222
47.38%
21
Robert Dole
Jack Kemp
Republican
1,859,883
41.02%
0
H. Ross Perot
James Campbell
Reform
483,207
10.66%
0
Harry Browne
Jo Jorgensen
Not Designated
12,851
0.28%
0
Other (
+
)
-
-
30,271
0.67%
0
Map Key
> 40%
> 50%
> 60%
> 70%
Turnout
Maps
Pop. (m)
Dem. (m)
Rep. (m)
Ref. (m)
Swg (m)
Tnd (m)
Demographic Data
2000 Population:
11,353,140
Enum.
2000 Population Density:
107.0
persons/km
2
1996 Population:
11,242,827
Est.
1996 Population Density:
106.0
persons/km
2
1990 Population:
10,847,115
Enum.
1990 Population Density:
102.3
persons/km
2
Total Electoral Vote:
21
Electoral Vote Density:
535,373
persons/EV
Land Area (2000):
106,056
km
2
Annual Pop Growth Rate:
0.5
%
Election Data and Statistics:
County Data (Table)
(m)
County Data (Graphs)
Voter Registration & Turnout Data
(m)
Purchase Detailed Data
Compare State Data by Year (Table)
Compare State Data by Year (Graphs)
View All 1996 Ohio Data
Compare State Maps by Year
View All 1996 Ohio Maps
Ohio JavaCompare
(m)
Election Tools
Atlas Forum
Image Code for Maps:
County
,
Pop
,
Tnd
,
Swg
Data Sources:
Source for Popular Vote data: Ohio Secretary of State,
Ohio Election Statistics Election Statistics for 1995-1996
(Cleveland, 1997)
Source for Population data: U.S. Census Bureau.
Results for and Individual County:
(m)
< 1992
Choose Year
2020
2016
2012
2008
2004
2000
1992
1988
1984
1980
1976
1972
1968
1964
1960
1956
1952
1948
1944
1940
1936
1932
1928
1924
1920
1916
1912
1908
1904
1900
1896
1892
1888
1884
1880
1876
1872
1868
1864
1860
1856
1852
1848
1844
1840
1836
1832
1828
1824
Choose Office
Choose State
Alabama
Alaska
Arizona
Arkansas
California
Colorado
Connecticut
Delaware
District of Columbia
Florida
Georgia
Hawaii
Idaho
Illinois
Indiana
Iowa
Kansas
Kentucky
Louisiana
Maine
Maryland
Massachusetts
Michigan
Minnesota
Mississippi
Missouri
Montana
Nebraska
Nevada
New Hampshire
New Jersey
New Mexico
New York
North Carolina
North Dakota
Oklahoma
Oregon
Pennsylvania
Rhode Island
South Carolina
South Dakota
Tennessee
Texas
Utah
Vermont
Virginia
Washington
West Virginia
Wisconsin
Wyoming
2000 >
Ohio Election Results Home
-
National Results for 1996
-
Use Frame Navigation
Login
Terms of Use
-
DCMA Policy
-
Privacy Policy and Cookies
©
Dave Leip's Atlas of U.S. Elections, LLC 2019 All Rights Reserved


