Home
2024
Election Results
Election Info
Weblog
Forum
Wiki
Search
Email
Login
Site Info
Store
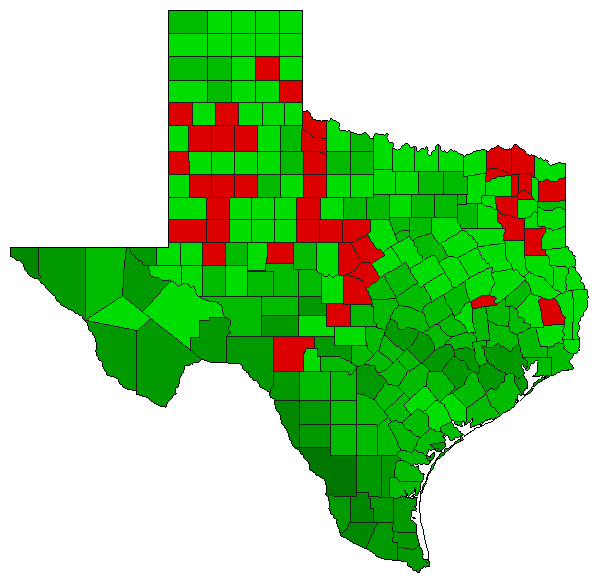
1991 Referendum Special Election Results - Texas
Note: The Google advertisement links below may advocate political positions that this site does not endorse.
Data for this Contest was Contributed by on 2007-04-10
Referendum: Referendum 11 Lottery
Popular Vote
Yes
1,331,618
64.49%
No
733,288
35.51%
Map Key
> 50%
> 60%
> 70%
> 80%
> 90%
Turnout
Maps
Pop. (m)
Election Notes:
5 November 1991 Referendum 11 "The constitutional amendment authorizing a state lottery."
Source, 'Houston Chronicle' 6 November 1991.
Fort Bend County 2 missing precincts. Zavala County missing. Zavala County calculated by difference between total and sum of counties.
Demographic Data
2000 Population:
20,851,820
Enum.
2000 Population Density:
30.8
persons/km
2
1991 Population:
17,398,005
Est.
1991 Population Density:
25.7
persons/km
2
1990 Population:
16,986,335
Enum.
1990 Population Density:
25.1
persons/km
2
Land Area (2000):
678,051
km
2
Annual Pop Growth Rate:
2.1
%
Election Data and Statistics:
County Data (Table)
(m)
County Data (Graphs)
Purchase Detailed Data
Compare State Maps by Year
View All 1991 Texas Maps
Election Tools
Atlas Forum
Image Code for Maps:
County
,
Pop
Data Sources:
Source for Popular Vote data: Unofficial, 'Houston Chronicle'.
Election '91/County-by-county returns on lottery
, Unofficial, 'Houston Chronicle' (http://www.chron.com/CDA/archives/archive.mpl?id=1991_820796) (accessed 10 Apr 2007)
Source for Population data: U.S. Census Bureau.
Results for and Individual County:
(m)
Choose Year
2007
2007
2005
2003
2003
2003
1995
1995
Choose Office
Choose State
Texas Election Results Home
-
National Results for 1991
-
Use Frame Navigation
Login
Terms of Use
-
DCMA Policy
-
Privacy Policy and Cookies
©
Dave Leip's Atlas of U.S. Elections, LLC 2019 All Rights Reserved


