Home
2024
Election Results
Election Info
Weblog
Forum
Wiki
Search
Email
Login
Site Info
Store
1982 Comptroller General General Election Results - California
Note: The Google advertisement links below may advocate political positions that this site does not endorse.
Data for this Contest was Contributed by on 2016-03-19
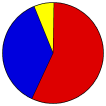
Comptroller General
Candidate
Political
Party
Popular Vote
Kenneth Cory
Democratic
4,244,801
56.59%
James L. Flournoy
Republican
2,776,973
37.02%
Florence McDonald
Peace & Freedom
183,683
2.45%
Pat Graham
American Independence
173,621
2.31%
Mary Gingell
Libertarian
121,964
1.63%
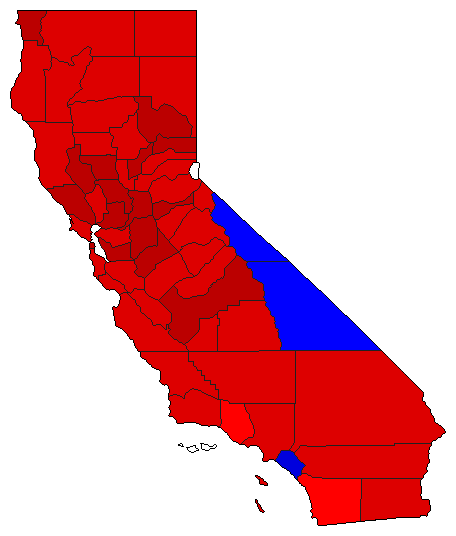
Map Key
> 40%
> 50%
> 60%
> 70%
Turnout
Maps
Pop. (m)
Demographic Data
1990 Population:
29,785,857
Enum.
1990 Population Density:
73.7
persons/km
2
1982 Population:
0
Est.
1982 Population Density:
0.0
persons/km
2
1980 Population:
23,667,765
Enum.
1980 Population Density:
58.6
persons/km
2
Land Area (2000):
403,933
km
2
Annual Pop Growth Rate:
2.3
%
Election Data and Statistics:
County Data (Table)
(m)
County Data (Graphs)
Purchase Detailed Data
Compare State Data by Year (Table)
Compare State Data by Year (Graphs)
View All 1982 California Data
Compare State Maps by Year
View All 1982 California Maps
Election Tools
Atlas Forum
Image Code for Maps:
County
,
Pop
Data Sources:
Source for Popular Vote data: California Secretary of State.
Statement of Vote
, California Secretary of State (https://ia800303.us.archive.org/4/items/statementofvote21982cali/statementofvote21982cali.pdf) (accessed 19 March 201)
Source for Population data: U.S. Census Bureau.
Results for and Individual County:
(m)
Choose Year
Choose Office
Senator
Governor
Lt. Governor
Secretary of State
State Treasurer
Attorney General
Controller
Choose State
Connecticut
Illinois
Maryland
California Election Results Home
-
National Results for 1982
-
Use Frame Navigation
Login
Terms of Use
-
DCMA Policy
-
Privacy Policy and Cookies
©
Dave Leip's Atlas of U.S. Elections, LLC 2019 All Rights Reserved


