Home
2024
Election Results
Election Info
Weblog
Forum
Wiki
Search
Email
Login
Site Info
Store
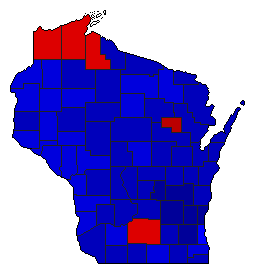
1998 Gubernatorial General Election Results - Wisconsin
Note: The Google advertisement links below may advocate political positions that this site does not endorse.
Gubernatorial
Candidate
Lt. Gubernatorial
Candidate
Political
Party
Popular Vote
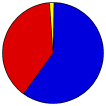
Tommy Thompson
Scott McCallum
Republican
1,047,716
59.66%
Ed Garvey
Barbara Lawton
Democratic
679,553
38.70%
Jim Mueller
James Dean
Libertarian
11,071
0.63%
Edward Frami
Thomas Rivers
Taypayers
10,269
0.58%
Mike Mangan
-
Independent
4,985
0.28%
Other (
+
)
-
-
2,420
0.14%
Map Key
> 40%
> 50%
> 60%
> 70%
Turnout
Maps
Pop. (m)
Rep. (m)
Dem. (m)
Swg (m)
Tnd (m)
Demographic Data
2000 Population:
5,363,675
Enum.
2000 Population Density:
38.1
persons/km
2
1998 Population:
5,297,672
Est.
1998 Population Density:
37.7
persons/km
2
1990 Population:
4,891,769
Enum.
1990 Population Density:
34.8
persons/km
2
Land Area (2000):
140,663
km
2
Annual Pop Growth Rate:
0.9
%
Election Data and Statistics:
County Data (Table)
(m)
County Data (Graphs)
Purchase Detailed Data
Compare State Data by Year (Table)
Compare State Data by Year (Graphs)
View All 1998 Wisconsin Data
Compare State Maps by Year
View All 1998 Wisconsin Maps
Election Tools
Atlas Forum
Image Code for Maps:
County
,
Pop
,
Tnd
,
Swg
Data Sources:
Source for Popular Vote data: Wisconsin State Election Board, "Governor,"
Wisconsin State Elections Board Canvass - County Totals Fall General Election Election Date: 11/03/98
(Madison, 1998)
Source for Population data: U.S. Census Bureau.
Results for and Individual County:
(m)
< 1994
Choose Year
2022
2018
2014
2010
2006
2002
1994
1990
2012
1986
1982
1978
1974
1970
1968
1966
1964
1962
1960
1958
1956
1954
1952
1950
1948
1946
1944
1942
1940
1938
1936
1934
1932
1930
1928
1926
1924
1922
1920
1918
1916
1914
1912
1910
1908
Choose Office
Senator
Secretary of State
State Treasurer
Attorney General
Amendment 1
Choose State
Alabama
Alaska
Arizona
Arkansas
California
Colorado
Connecticut
Florida
Georgia
Hawaii
Idaho
Illinois
Iowa
Kansas
Maine
Maryland
Massachusetts
Michigan
Minnesota
Nebraska
Nevada
New Hampshire
New Mexico
New York
Ohio
Oklahoma
Oregon
Pennsylvania
Rhode Island
South Carolina
South Dakota
Tennessee
Texas
Vermont
Wyoming
2002 >
Wisconsin Election Results Home
-
National Results for 1998
-
Use Frame Navigation
Login
Terms of Use
-
DCMA Policy
-
Privacy Policy and Cookies
©
Dave Leip's Atlas of U.S. Elections, LLC 2019 All Rights Reserved


