Home
2024
Election Results
Election Info
Weblog
Forum
Wiki
Search
Email
Login
Site Info
Store
2008 Presidential Democratic Primary Election Results
Note: The Google advertisement links below may advocate political positions that this site does not endorse.
Presidential
Candidate
Home State
Political
Party
Primary Vote
Delegates
Barack Obama
Illinois
Democratic
532,665
60.66%
42
42.4%
Hillary Clinton
New York
Democratic
314,211
35.78%
28
28.3%
Uncommitted
-
Democratic
11,417
1.30%
0
0.0%
John Edwards
North Carolina
Democratic
10,506
1.20%
0
0.0%
Joe Biden
Delaware
Democratic
3,776
0.43%
0
0.0%
Other (
+
)
-
Democratic
5,599
0.64%
0
0%
Unallocated
-
Democratic
-
-
29
29.3%
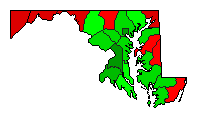
Map Key
> 40%
> 50%
> 60%
> 70%
Turnout
Maps
Election Information:
Contest Type:
State-run Primary
Election Date:
2008-02-12
Eligible Participants:
Closed (only members of the party)
Delegates Awarded in this Contest:
70
Delegates Total:
99
Delegate Allocation Method:
Proportional - the candidates are awarded delegates in proportion to the percentage of votes received. A 15% threshold is required to receive delegates.
24 at-large delegates
46 district delegates
29 unpledged delegates
Congressional District 1: 5 delegates
Congressional District 2: 5 delegates
Congressional District 3: 6 delegates
Congressional District 4: 7 delegates
Congressional District 5: 6 delegates
Congressional District 6: 4 delegates
Congressional District 7: 6 delegates
Congressional District 8: 7 delegates
Demographic Data
2010 Population:
5,773,552
Enum.
2010 Population Density:
228.1
persons/km
2
2008 Population:
5,684,965
Est.
2008 Population Density:
224.6
persons/km
2
2000 Population:
5,296,486
Enum.
2000 Population Density:
209.2
persons/km
2
Total Delegates:
99.0
Delegates Density:
57,424
persons/Del
Land Area (2000):
25,314
km
2
Annual Pop Growth Rate:
0.9
%
Election Data and Statistics:
County Data (Table)
(m)
County Data (Graphs)
Congressional District Data
(m)
Purchase Detailed Data
Compare State Maps by Year
View All 2008 Maryland Maps
Election Tools
2008 Democratic Primary Timeline
Atlas Forum
Image Code for Maps:
County
,
CD
,
Pop
Data Sources:
Source for Popular Vote data:
Source for Population data: U.S. Census Bureau.
Results for and Individual County:
Allegany County
Anne Arundel County
Baltimore County
Calvert County
Caroline County
Carroll County
Cecil County
Charles County
Dorchester County
Frederick County
Garrett County
Harford County
Howard County
Kent County
Montgomery County
Prince George's County
Queen Anne's County
St. Mary's County
Somerset County
Talbot County
Washington County
Wicomico County
Worcester County
Baltimore City
< 2004
Choose Year
2020
2016
2004
2000
1992
Choose Office
Choose Party
Republican
Choose State
Alabama
Alaska
American Samoa
Arizona
Arkansas
California
Colorado
Colorado
Connecticut
Delaware
District of Columbia
Florida
Georgia
Guam
Hawaii
Idaho
Idaho
Illinois
Indiana
Iowa
Iowa
Kansas
Kentucky
Louisiana
Maine
Massachusetts
Michigan
Minnesota
Mississippi
Missouri
Montana
Nebraska
Nebraska
Nevada
Nevada
New Hampshire
New Jersey
New Mexico
New York
North Carolina
North Dakota
Ohio
Oklahoma
Oregon
Pennsylvania
Puerto Rico
Rhode Island
South Carolina
South Dakota
Tennessee
Texas
Texas
Texas
Utah
Vermont
Virgin Islands
Virginia
Washington
Washington
West Virginia
Wisconsin
Wyoming
2016 >
Maryland Election Results Home
-
National Results for 2008
-
Use Frame Navigation
Login
Terms of Use
-
DCMA Policy
-
Privacy Policy and Cookies
©
Dave Leip's Atlas of U.S. Elections, LLC 2019 All Rights Reserved


