Note: The Google advertisement links below may advocate political positions that this site does not endorse.
Official Results
  Presidential
Candidate
Home StatePolitical
Party
Primary VoteDelegates
Bernie SandersVermontDemocratic 174,228 51.88%21 50.0%
Hillary ClintonNew YorkDemocratic 139,443 41.52%17 40.5%
Martin O'MalleyMarylandDemocratic 7,672 2.28%0 0.0%
Keith JuddTexasDemocratic 4,386 1.31%0 0.0%
Michael A. SteinbergFloridaDemocratic 4,171 1.24%0 0.0%
Star LockeTexasDemocratic 3,458 1.03%0 0.0%
Roque 'Rocky' De La FuenteCaliforniaDemocratic 2,485 0.74%0 0.0%
YUnallocated - Democratic - -49.5%
Total Vote 335,843
Maps
2016 Presidential Democratic Primary - Oklahoma Election County Map
County H
County Pop H
Per Vote Democratic Button H
County H
 
(Note: click the 'H' buttons above to hold the given map and change the image map)
PerClintonSandersPie
>20%


pie
>30%


>40%


>50%


>60%


>70%


>80%


>90%


 Election Data and Statistics:
Data Sources:
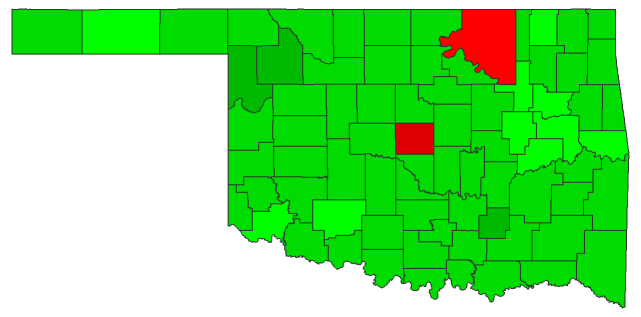
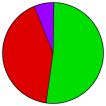
  • Source for Popular Vote data: Oklahoma State Election Board. Official Results Presidential Preferential March 1, 2016 - For President, Oklahoma State Election Board (https://www.ok.gov/elections/Election_Info/2016_March_PPP_Election.html) (accessed 05 Mar 2016)


Classic Oklahoma Results for 2016 - National Results for 2016

Login

Terms of Use - DCMA Policy - Privacy Policy and Cookies


© Dave Leip's Atlas of U.S. Elections, LLC 2019 All Rights Reserved