Note: The Google advertisement links below may advocate political positions that this site does not endorse.
Official Results
  Senatorial
Candidate
Political
Party
Popular Vote
Ron JohnsonRepublican 1,479,471 50.17%
Russ FeingoldDemocratic 1,380,335 46.81%
Phillip N. AndersonLibertarian 87,531 2.97%
YOther (+) - 1,404 0.05%
Total Vote 2,948,741
Maps
2016 Senatorial General Election - Wisconsin Election County Map
County H
County Pop H
2010 Button H
Per Vote Republican Button H
Per Vote Democratic Button H
Swing Map Button H
Trend Map Button H
Town H
Last Button H
Per Vote Republican Button H
Per Vote Democratic Button H
Swing Map Button H
Trend Map Button H
 
(Note: click the 'H' buttons above to hold the given map and change the image map)
PerDemocraticRepublicanPie
>20%
 
0
 
 
0
 
pie
>30%
 
0
 
 
0
 
>40%
 
62
 
 
62
 
>50%
 
200
 
 
200
 
>60%
 
70
 
 
70
 
>70%
 
14
 
 
14
 
>80%
 
3
 
 
3
 
>90%
 
1
 
 
1
 
 Election Data and Statistics:
Data Sources:
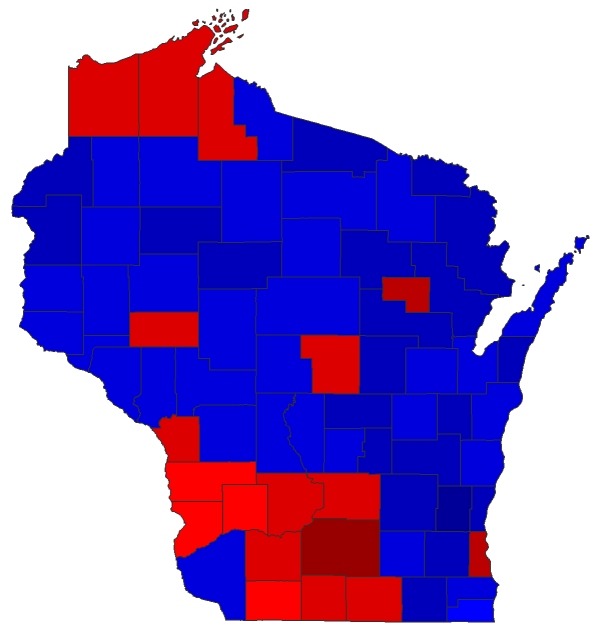
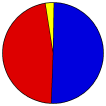
  • Source for Popular Vote data: Wisconsin Government Accountability Board. WEC Canvass Reporting System County by County Report 2016 General Election, Wisconsin Government Accountability Board (http://elections.wi.gov/sites/default/files/County by County Report-US Senate.pdf) (accessed 02 Dec 2016)


Classic Wisconsin Results for 2016 - National Results for 2016

Login

Terms of Use - DCMA Policy - Privacy Policy and Cookies


© Dave Leip's Atlas of U.S. Elections, LLC 2019 All Rights Reserved