PredictionsNewsMock2008 Presidential Election Polls - TX ResultsForumPolls
Note: The Google advertisement links below may advocate political positions that this site does not endorse.

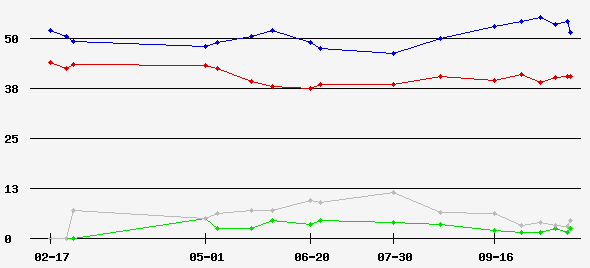
Texas Polls (Aggregate = Strong McCain for 3-poll average)

Candidate Party Avg. #Wins EV Poll Graph
McCain Republican 52% 3 34pie
Obama Democratic 41% 0 0
Other - 3% 0 0
-Undecided- 5% 0 0

 Three-Poll Rolling Average
 Rolling Average Poll Graph

DatePoll Source Spread McCain Obama OtherUnd M.O.E. Sample#C
2008-10-22Other SourceM +1149%38%4%9%4%550 R0
2008-10-21RasmussenM +1054%44%0%1%5%500 L0
2008-10-15Research 2000M +1252%40%4%4%4%600 L0
2008-10-08ARGM +1957%38%1%4%4%600 L0
2008-09-29RasmussenM +952%43%3%2%5%500 L0
2008-09-16ARGM +2157%36%1%6%4%600 L0
2008-08-21RasmussenM +1054%44%1%2%5%500 L0
2008-07-30Other SourceM +1043%33%7%17%4%668 R0
2008-07-30RasmussenM +852%44%1%4%5%500 L0
2008-06-25RasmussenM +948%39%6%7%5%500 L0
2008-06-20Other SourceM +543%38%2%17%3%1,000 L0
2008-06-02RasmussenM +1352%39%6%3%4%500 L0
2008-05-23Other SourceM +1652%36%3%9%3%1,005 P0
2008-05-07Research 2000M +1352%39%0%9%4%600 L0
2008-05-01RasmussenM +548%43%5%3%5%500 L0
2008-02-28Survey USAM +147%46%0%7%4%600 R0
2008-02-25Survey USAM +849%41%0%0%2%1,725 R0
2008-02-17CNN/TimeM +852%44%0%0%3%1,506 R0


Back to 2008 Presidential Polls Home - Polls Home


Terms of Use - DCMA Policy - Privacy Policy and Cookies

© Dave Leip's Atlas of U.S. Elections, LLC 2019 All Rights Reserved