


Note: The Google advertisement links below may advocate political positions that this site does not endorse.
|
Date of Prediction: 2012-11-06 Version:21
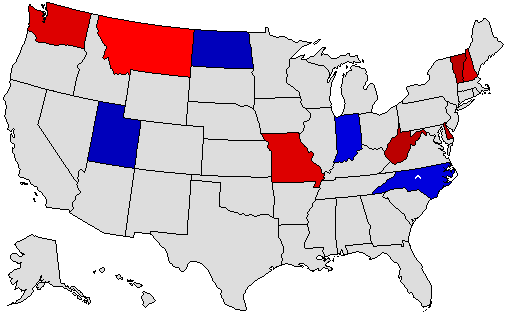
Prediction Map
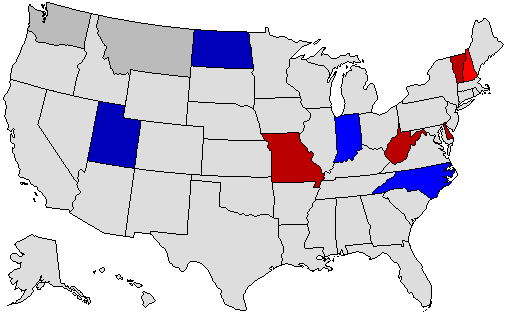
* = Pickup via defeat of incumbent; ^ = Pickup of an open seat Confidence Map
Prediction States Won
Confidence States Won
State Pick-ups
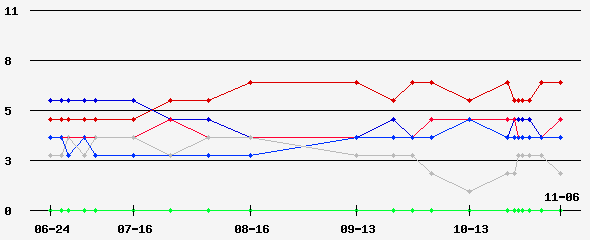
Prediction Score (max Score = 8)
Analysis
Republican pickup one more governorship this cycle. Closest races are Montana and Washington. Democrats will prevail narrowly in both. Hassan is pulling away in New Hampshire. Negative coattails on the part of Mourdock in Indiana is hurting Pence in Indiana but not nearly enough to cost him the race.
Prediction History
Comments History
- hide
Version: 20 Democrats make decisive late moves in guv races, however GOP makes more gains in their quest to have most governorships since 1998. Version: 19 Montana, Washington, and New Hampshire appear to be the only competitive gubernatorial races this cycle.
Version History Member Comments User's Predictions
User Info
Links
|
||||||||||||||||||||||||||||||||||||||||||||||||||||||||||||||||||||||||||||||||||||||||||||||||||||||||||||||||||||||||||||||||||||||||||||||||||||||||||||||||||||||||||||||||||||||||||||||||||||||||||||||||||||||||||||||||||||||||||||||||||||||||||||||||||||||||||||||||||||||||||||||||||||||||||||||||||||||||||||||||||||||||||||||||||||||||||||||||||||||||||||||||||||||||||||||||||||||||||||||||||||||||||||||||||||||||||||||||||||||||||||||||||||||||||||||||||||||||||||||||||
 2024 President
 2023 Governor
 2022 Senate
 2022 Governor
 2020 President
 2020 Senate
 2020 Governor
 2019 Governor
 2018 Senate
 2018 Governor
 2016 President
 2016 Senate
 2016 Governor
 2014 Senate
 2014 Governor
 2012 President
 2012 Senate
 2012 Governor
 2012 Rep Primary
 2011 Governor
 2010 Senate
 2010 Governor
 2009 Governor
 2008 President
 2008 Senate
 2008 Governor
 2007 Governor
 2006 U.S. Senate
 2006 Governor
 2004 President


Back to 2012 Gubernatorial Prediction Home - Predictions Home
© Dave Leip's Atlas of U.S. Elections, LLC 2019 All Rights Reserved