


Note: The Google advertisement links below may advocate political positions that this site does not endorse.
|
Date of Prediction: 2020-11-03 Version:1
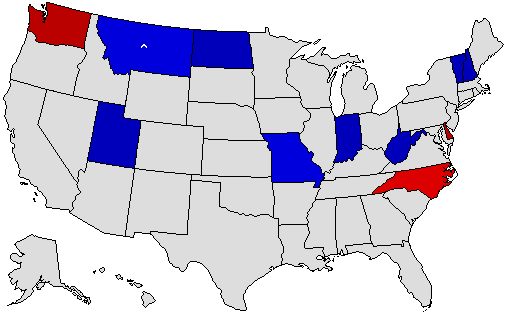
Prediction Map
* = Pickup via defeat of incumbent; ^ = Pickup of an open seat Confidence Map
Prediction States Won
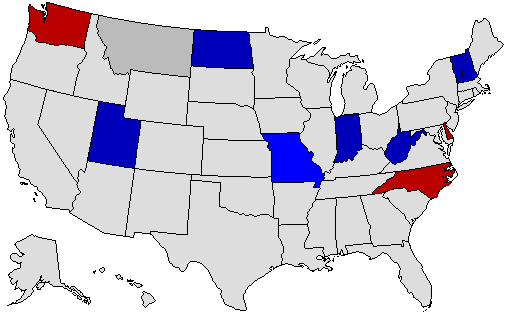
Confidence States Won
State Pick-ups
Prediction Score (max Score = 22)
Analysis
11/2/2020: Final Map. GOP picks up one seat in Montana. Gubernatorial races are somewhat less susceptible to national trends, so most incumbents will by comfortable margins. Member Comments User's Predictions
Links
|
||||||||||||||||||||||||||||||||||||||||||||||||||||||||||||||||||||||||||||||||||||||||||||||||||||||||||||||||||||||||||||||||||||||||||||||||||||||||||||||||||||||||||||||||||||||||||||||||||||||||||||||||||||||||||||||||||||||||||||||||||||||||||||||||||||||||||||||||||||||||||||||||||||||||||||||||||||||||||||||||||||||||||||||||||||||||||||||||||||||||||||||||||||||||||||||||||||||||||||||||||||||||||||||
 2022 Senate
 2022 Governor
 2020 President
 2020 Senate
 2020 Governor
 2018 Senate
 2018 Governor
 2016 President
 2016 Senate
 2016 Governor
 2014 Senate
 2014 Governor
 2012 President
 2012 Senate
 2012 Governor
 2010 Senate
 2010 Governor
 2008 President
 2008 Senate
 2008 Dem Primary
 2008 Rep Primary
 2006 U.S. Senate
 2006 Governor
 2004 President


Back to 2020 Gubernatorial Prediction Home - Predictions Home
© Dave Leip's Atlas of U.S. Elections, LLC 2019 All Rights Reserved