


|
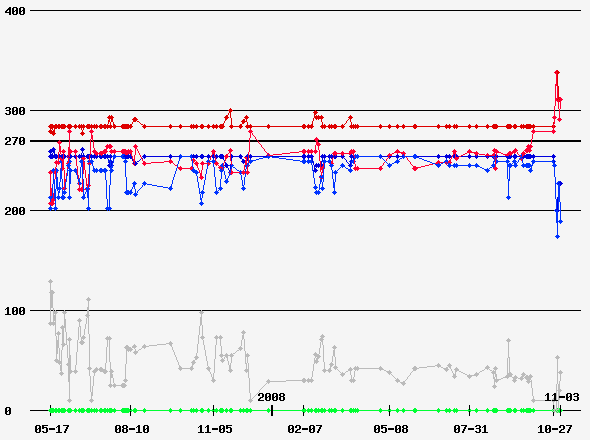
Date of Prediction: 2008-11-03 Version:129
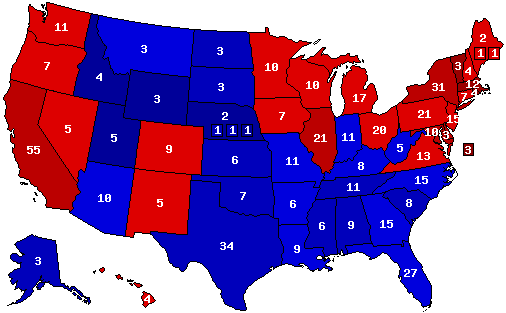
Prediction Map
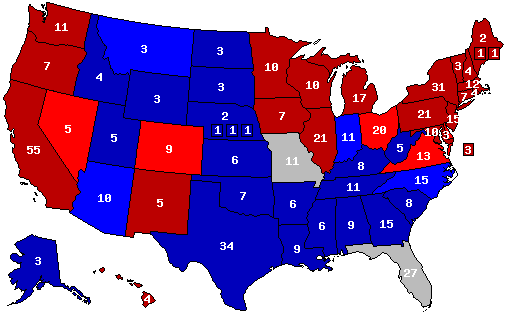
Confidence Map
Prediction States Won
Confidence States Won
State Pick-ups
Prediction Score (max Score = 112)
Analysis
No Analysis Entered
Prediction History
Comments History
- hide
Version: 127 Obama gets around 300 electoral votes Version: 126 Last preiction. Version: 124 CO,OH goes Democrat Version: 122 Final prediction: Version: 121 D favored: IA,NM,OR Version: 115 Down to my final predictions: Version: 114 top tier: CO,OH,NH Version: 112 Top tier: IO,NM,OH Version: 111 Top tier: CO,IO,OH, Version: 109 Top Tier: WI,IO,NM,OH Version: 108 top tier: IO,NM,OH Version: 103 order of change parties: IO,NM,NH,CO,OH,WI Version: 90 Obama 49.7% Version: 87 Obama vs. McCain. Version: 85 CO, NM, IA, and OH should be the states to watch out for, everything else leans one way or the other. Version: 83 TUPS: CO, FL, IA, and OH Version: 79 Obama 51% Version: 76 B. Obama 50% Version: 70 Dem 50%-Rep 48% Version: 62 Moved MO to lean Democratic Version: 58 Moved CO and FL to tossups and moved NM to lean Democratic and NV to lean republican. Version: 56 Decided to go with a more traditional map. Version: 55 Moved CO and FL to tossups Version: 37 Clinton-Richardson v. Giuliani-Huckabee Version: 36 This is a scenario based on how I see the race turing out. I think the Dems will end up winning based on the unpopularity of the republican party with the missed opportunities in the Bush administration. And the Dems probably will capitalize on it. I am not going to share who I am pulling for this election primary. But I am betting my prediction on who I see is the strongest challenger to win the states necessary to win this election. Version: 28 Map purely speculative based on the current frontrunners Ms. Clinton vs. Giuliani, based on the advantage the Dems enjoy for now. Version: 27 Map reflects the current Gallup polls showing a much tighter race in the national vote total. OH remains the state to watch out for. Version: 25 closest states: wisconsin, new mexico, iowa, ohio, and nevada Version: 24 Closest states: Nevada, New Mexico, Iowa, and Ohio Version: 22 Moved NC, KY, VA, and WV to lean independent candidacy is having an effect there. Version: 21 Map of Giulian or F.Thompson v. Ms.Clinton. Version: 20 Map based on current frontrunners and the current surveys that were released. Giuliani or F.Thompson v. Ms.Clinton. The Dems are favored at the present time but the election is a long way off and will be close at the end. Version: 19 Giuliani v. Ms.Clinton Version: 17 Battleground states: iowa, wisconsin, new mexico, ohio, florida, colorada, and nevada. Version: 16 Map is a scenario based on the current frontrunners: Ms.Clinton v. Giuliani or F.Thompson Version: 15 Hillary v. Giuliani or F.Thompson map Version: 14 In a Hillary v. F.Thompson or Giuliani matchup remaining close states are mostly: Iowa, Ohio, and Wisconsin. Version: 13 Map represents one scenario of what I predict the election outcome will turn out, and it is based on the current frontrunners: Mrs.Clinton v. Giuliani. Other states may become more competetive, but will wait until after the primaries to see how well each match up with one another. Watch out for states like NV, and CO, where the GOP have been able to win in the past but the hispanic population may be able to overcome their advantage. Version: 12 Map shows a scenario of the election outcome between the frontrunners. Version: 10 States that were the closest in 2000 and 2004 Version: 9 Using current frontrunners Giuliani v. Hillary. Version: 8 Moved PA to slight lean Democrat due to the consistently close race in PA the republicans are running in PA. Version: 7 Moved MI, NH, and NM to slight lean Mrs.Clinton and moved FL, MO, and WV to slight lean Giuliani. No clear favorite in CO, IA, OH, and NM.
Version History Member Comments User's Predictions
Links
|
||||||||||||||||||||||||||||||||||||||||||||||||||||||||||||||||||||||||||||||||||||||||||||||||||||||||||||||||||||||||||||||||||||||||||||||||||||||||||||||||||||||||||||||||||||||||||||||||||||||||||||||||||||||||||||||||||||||||||||||||||||||||||||||||||||||||||||||||||||||||||||||||||||||||||||||||||||||||||||||||||||||||||||||||||||||||||||||||||||||||||||||||||||||||||||||||||||||||||||||||||||||||||||||||||||||||||||||||||||||||||||||||||||||||||||||||||||||||||||||||||||||||||||||||||||||||||||||||||||||||||||||
 2024 President
 2023 Governor
 2022 Senate
 2022 Governor
 2021 Governor
 2020 President
 2020 Senate
 2020 Governor
 2019 Governor
 2018 Senate
 2018 Governor
 2017 Governor
 2016 President
 2016 Senate
 2016 Governor
 2015 Governor
 2014 Senate
 2014 Governor
 2013 Governor
 2012 President
 2012 Senate
 2012 Governor
 2012 Rep Primary
 2011 Governor
 2010 Senate
 2010 Governor
 2009 Governor
 2008 President
 2008 Senate
 2008 Governor
 2008 Dem Primary
 2008 Rep Primary
 2007 Governor
 2006 U.S. Senate
 2006 Governor
 2004 President
Back to 2008 Presidential Prediction Home - Predictions Home