


Note: The Google advertisement links below may advocate political positions that this site does not endorse.
|
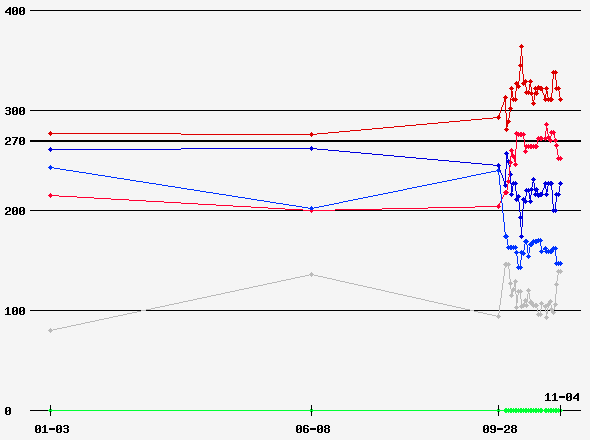
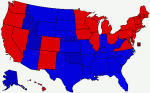
Date of Prediction: 2008-11-04 Version:36
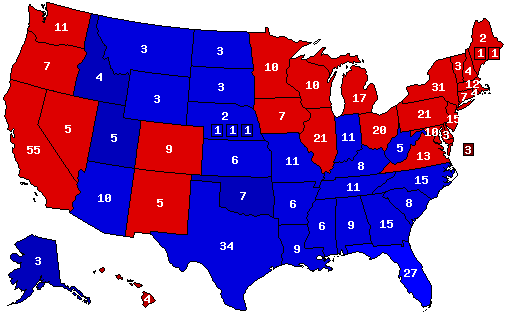
Prediction Map
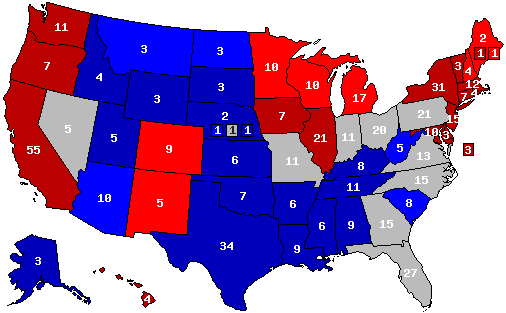
Confidence Map
Prediction States Won
Confidence States Won
State Pick-ups
Prediction Score (max Score = 112)
Analysis
Final prediction. Its a boring, conservative prediction, but I think that it is the most likely one.
Prediction History
Comments History
- show
Version History Member Comments
User's Predictions
Links
|
||||||||||||||||||||||||||||||||||||||||||||||||||||||||||||||||||||||||||||||||||||||||||||||||||||||||||||||||||||||||||||||||||||||||||||||||||||||||||||||||||||||||||||||||||||||||||||||||||||||||||||||||||||||||||||||||||||||||||||||||
 2024 President
 2020 President
 2020 Senate
 2016 President
 2012 President
 2012 Senate
 2012 Governor
 2012 Rep Primary
 2008 President
 2004 President
Back to 2008 Presidential Prediction Home - Predictions Home
© Dave Leip's Atlas of U.S. Elections, LLC 2019 All Rights Reserved