Comments History
-
hideVersion: 57
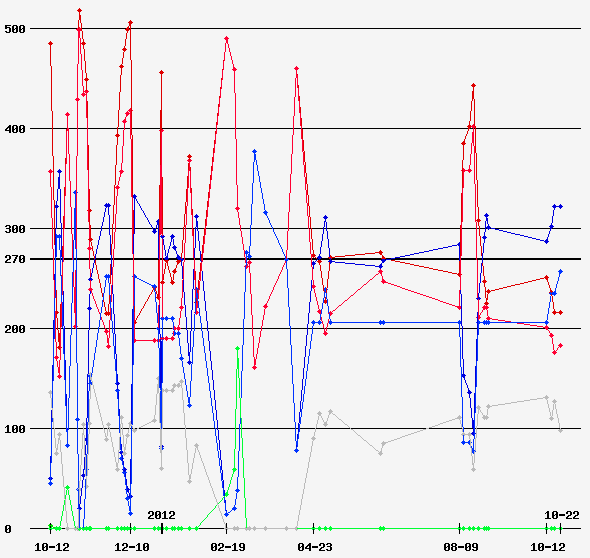
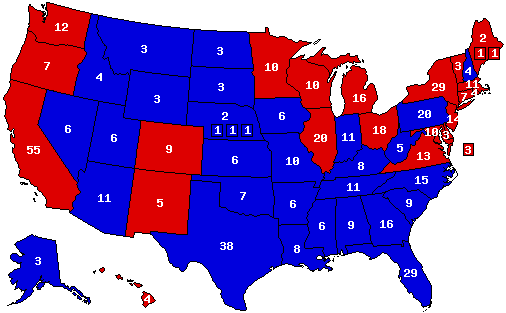
This is where the election is headed.
Version: 56
Surprise of the election night: How close Connecticut is although Obama pulls it out in the end. This is my prediction for election night, not how the vote would be if it was held today.
Version: 55
Barring WWIII or one of the candidates completely melting down during one of the last two debates I think this is where we end up. Romney 51% Obama 48%
Version: 54
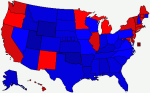
Based on current trends this is my current prediction of where I think the electoral map will be the day before the election. Michigan is the most likely to be the one that doesn't match my map, followed by Pennsylvania being a tossup instead of lean dem.
Version: 53
Based on current trends this is my current prediction of where I think the electoral map will be the day before the election. Michigan is the most likely to be the one that doesn't match my map, followed by Pennsylvania being a tossup instead of lean dem.
Version: 52
Pennsylvania was extremely close in my current simulation:
Obama 3,000,211
Romney 2,970,179
National popular vote:
Obama 64,005,060
Romney 67,389,937
Version: 51
Current poll numbers used in the ES2012 program; amazingly close race with Obama winning the electoral vote and thus the Presidency and Romney winning the popular vote by 177,369 votes.
Version: 50
Worst case scenario now computed in the election simulator 2012. Seniors, Hispanics, Asians, African Americans, white women and young whites turn out heavily for Obama. In a couple days I'll go back to using the state polls and national polls to create snapshot electoral maps. I don't think it will get this bad, I just wanted to see what the map looks like based on heavy turnout from Obama combined with a low Romney vote from Hispanics, Asians, seniors and white women. He has no shot at the African American vote and best case scenario for the youth vote is they stay home (which is very possible). To the numbers!
National popular vote
Romney/Ryan 54,081,281
Obama/Biden 74,191,664
House
Dems 248
Reps 187
Senate
Dems 55*
Reps 45
Version: 49
The fallout continues....
Version: 48
The Ryan effect. With his budget plans Romney has lost the senior vote and by picking a catholic the white protestant vote will be weak. Also by not picking Rubio the hispanic vote is lost. Add in the jewish vote coming home to Obama after he attacks Iran and we've got ourselves a landslide election.
National vote
Romney/Ryan 58,987,102
Obama/Biden 72,097,928
Version: 47
This is my current personal guess about the outcome of the election; Election Simulator 2012 version 4 will be run later this week and I'll use the results for my next map.
Version: 46
Election Simulator 2012 3.0
Sorry about the delay; all information has been added to the election simulator 2012 and this is the result. I'll add more info and in-depth analysis later; took me over an hour of putting in data to finalize the first map. Future upgrades will simply be putting in newer polls which will only take minutes thankfully.
National number:
Romney 49.04%
Obama 48.78%
Others 2.18%
Colorado, Iowa, Ohio, Virginia and Florida are the five key states for the 2012 election. While Wisconsin is currently a tossup I'll need to see a tie or Romney lead over a longer period of time to truely think it'll be in play.
Version: 45
Sorry about the delay; all information has been added to the election simulator 2012 and this is the result. I'll add more info and in-depth analysis later; took me over an hour of putting in data to finalize the first map. Future upgrades will simply be putting in newer polls which will only take minutes thankfully.
National number:
Romney 48.97%
Obama 48.79%
Others 2.24%
Version: 44
Election Simulator 2012 Version 2.2
Last two weeks worth of Romney vs Obama polls used. Leans and tossups included in this version but no percentages yet. As of right now it looks like a razor close election if it were to be held today. Since 1976 over 80% of undecided voters break for the challenger on election day. History shows that the percentage of the vote that an incumbent president gets in the polls before Election Day is an accurate predictor of the percentage of the vote that he'll win on Election Day; an incumbent who fails to poll above 50% in the days right before an election is in serious danger of losing. The average increase on election day in the actual vote for a challenger to a president is 4 percentage points.
This time I used a number more in line with historical norms but still kept a slight Obama edge: Romney 68% Obama 30% Other 2%
National Vote Total by applying undecided formula
Romney 49.052%
Obama 49.035%
Others 1.913%
Note: Ohio, Nevada and New Hampshire were won with margins of victory less than 1%; this scenario would be a recount nightmare.
Version: 43
Election Simulator 2012 Version 2.2
Last two weeks worth of Romney vs Obama polls used. Leans and tossups included in this version but no percentages yet. As of right now it looks like a razor close election if it were to be held today. Since 1976 over 80% of undecided voters break for the challenger on election day. History shows that the percentage of the vote that an incumbent president gets in the polls before Election Day is an accurate predictor of the percentage of the vote that he'll win on Election Day; an incumbent who fails to poll above 50% in the days right before an election is in serious danger of losing. The average increase on election day in the actual vote for a challenger to a president is 4 percentage points.
Last version: Despite this I have decided to be conservative and broke the undecided vote down as follows: Romney 55% Obama 43% Other 2%
This time I used a number more in line with historical norms but still kept a slight Obama edge: Romney 70% Obama 28% Other 2%
National Vote Total by applying undecided formula
Romney 50.015%
Obama 48.072%
Others 1.913%
Not a big change in national popular vote but it causes several states to (barely) switch.
If anyone wants to me to use a different set of numbers I'll run them for you; maybe Obama will defy history and capture 60% of the undecided!
Version: 42
Election Simulator 2012 Version 2.1
Last two weeks worth of Romney vs Obama polls used. Leans and tossups included in this version but no percentages yet. As of right now it looks like a razor close election if it were to be held today. Difference from last version: Since 1976 over 80% of undecided voters break for the challenger on election day. History shows that the percentage of the vote that an incumbent president gets in the polls before Election Day is an accurate predictor of the percentage of the vote that he'll win on Election Day; an incumbent who fails to poll above 50% in the days right before an election is in serious danger of losing. The average increase on election day in the actual vote for a challenger to a president is 4 percentage points. Despite this I have decided to be conservative and broke the undecided vote down as follows: Romney 55% Obama 43% Other 2%
National Vote Total by applying undecided formula
Romney 49.065%
Obama 49.023%
Others 1.912%
Version: 41
Election Simulator 2012 Version 2.0
Last two weeks worth of Romney vs Obama polls used. Leans and tossups included in this version but no percentages yet. As of right now it looks like a razor close election if it were to be held today.
Version: 40
Election Simulator 2012 Version 1.3
This was a fun prediction to just test drive the software; all polls taken during the last 24 months with Obama vs anyone or generic republican being plugged in and then adjusted with the trending numbers. June 1st will be the first real Election Simulator prediction; we should have a full month of polls of Romney vs Obama by then. Before any of my fellow Republicans have a heart attack the real one will have more blue; the question is how much?
Version: 39
Election Simulator 2012 Version 1.2
No percentages for the states yet; still a preliminary prediction using the election simulator. When the final tweaks are made the numbers used and how they are applied will be fully explained. After the April 24th voting the first full Election Simulator prediction will be unveiled.
Version: 38
Election Simulator 2012 Version 1.1
No percentages for the states yet; still a preliminary prediction using the election simulator. When the final tweaks are made the numbers used and how they are applied will be fully explained. A better tweaked map right now would also have Minnesota and New Mexico red; Wisconsin red but a tossup; Iowa, Colorado, Nevada, Virginia and Ohio blue but a tossup.
Version: 37
Election Simulator 2012 Version 1.0
Uses last national poll showing Romney 48% Obama 43%
As the election gets closer state by state numbers will be plugged in instead of using the generic national numbers; currently each state is weighted by history and adjusted off the current national numbers. Romney would win if the election was held today but probably not by 261 EVs.
Version: 36
Obama ditches Biden and picks Bill Richardson in the hopes of winning some more western states to offset his losses in the rust belt; it almost works with Obama holding Nevada, Colorado and New Mexico while picking up Arizona and Montana plus a surprise win in Missouri. Romney and McDonnell do well in the south and rust belt and eked out a victory.
Percentages and tossup/lean/solid not used for this iteration.
Version: 35
Percentages and lean/tossup are turned off for this iteration. This is simply the map I currently think will be the result in November; the map will swing drastically between now and then based on events, the question is which way will the map be swinging on election day?
Version: 34
Red: Obama/Biden
Green: Santorum/Bachmann
Blue: Romney/Sandoval or Rubio
This map assumes a large turnout of the right wing & evangelicals for Santorum; states with a large percentage of evangelicals (basically the states over 30%, in some states evangelicals comprise over 50% of the population!) are given to Santorum due to the disproportionate numbers that would turn up at the polls for him. A large turnout of moderate republicans coupled with a majority of independents for Romney causes him to win a few states and keep in the 30's in others. With unemployment hovering slightly over 9% and gas between $5-$6 a gallon Obama loses a significant percentage of white working class and middle class voters; turnout of the progressive base is low with the exception of the African American community. Despite all this the splintering of the vote for the GOP keeps Obama in power. For people following my last couple of maps this is the version where Obama does badly on election day.
Version: 33
Red: Obama/Biden
Green: Santorum/Bachmann
Blue: Romney/Sandoval or Rubio
Any state Obama won in 2008 by 40% or more he would win easy this time around with the GOP splitting its votes. This election will set a record turnout with moderate republicans and centrist independents for Romney, the inner city turnout and some independents for Obama and the massive right wing turnout for Santorum. If it's just Romney a large percentage of the right will stay home, with Santorum some moderate republicans would stay home and a lot of independents would either stay home or vote for Obama. Due to Santorum and Romney both being on the ballot there will be significantly higher GOP turnout due to being able to pick a moderate candidate or a right wing candidate; it will be as much boon as bust for the GOP; no chance of winning the Presidency, but will cruise to wins in the Senate and House.
Version: 32
Red: Obama/Biden
Green: Santorum/Palin
Blue: Romney/Sandoval
Any state Obama won in 2008 by 40% or more he would win easy this time around with the GOP splitting its votes. This election will set a record turnout with moderate republicans and centrist independents for Romney, the inner city turnout and some independents for Obama and the massive right wing turnout for Santorum. If it's just Romney a large percentage of the right will stay home, with Santorum some moderate republicans would stay home and a lot of independents would either stay home or vote for Obama. Due to Santorum and Romney both being on the ballot there will be significantly higher GOP turnout due to being able to pick a moderate candidate or a right wing candidate; it will be as much boon as bust for the GOP; no chance of winning the Presidency, but will cruise to wins in the Senate and House.
Version: 31
Romney vs Obama
Version: 30
Obama vs Newt
Map is for fun - despite the hysterics over a Newt nomination he can't win enough delegates to get it. He failed to even get on the ballot in his home state of Virginia so Mitt and Paul will split the delegates; most southern states allocate delegates proportionally and the winner-take-all states include several big states more likely to be friendly to Romney: California, New York, Connecticut, Oregon, etc. Even if Newt surges beyond everyones wildest dreams he would then just win the popular vote and not the delegate vote. (and if you're wondering which one is more important simply ask Hillary Clinton; she received 18,045,829 votes to Obamas 17,869,419)
Version: 29
Biden dies and Obama picks Bill Richardson. Romney picks Chris Christie. Economy slightly worsens with a slight uptick in unemployment which results in a rust belt rebellion against Obama; Liberal white turnout falls slightly along with some blue collar whites who voted for Obama last time voting for Romney this time. Latinos turn out heavily and vote for Obama by over a 2-1 margin due to Richardson being on the ticket; Black turnout is roughly the same as last time. New Jersey, Texas, Oregon and Minnesota become the key swing states.
Version: 28
Another odd looking but possible map of Obama - Romney.
Version: 27
Strange but still possible map of an Obama-Romney election
Version: 26
Romney/Rubio
vs
Obama/Biden
RR 51.0%
OB 47.1%
Other 1.9%
Version: 25
Romney/Rubio
vs
Obama/Biden
Version: 24
Romney/Rubio 51.1%
Obama/Biden 45.1%
Other 3.8%
Version: 23
Santorum - Bachmann 40.12%
Obama - Clinton 53.02%
Others 06.86%
Have a slightly higher then normal number for third party candidates due to a large number of people not wanting Obama or Santorum; number could actually be much higher depending on who makes a run. Bloomberg and Trump come to mind and although they wouldn't win they could be in the double digits easy.
Version: 22
Romney 50.24%
Obama 47.31%
Others 2.45%
Version: 21
Romney 49.90%
Obama 47.65%
Others 2.45%
Version: 20
Romney/? vs Obama/Biden
Assuming the economy remains about the same and Romney picks a competent but boring VP. Map looks very blue but in some of the states, especially Michigan, Wisconsin and Pennsylvania, the win is razor thin like the Obama wins in Indiana, North Carolina and Florida in 2008.
Version: 19
Obama/Clinton vs Palin/Bachmann
Assuming a small to moderate economic recovery by October with unemployment falling under 8%.
Version: 18
Obama/Clinton vs Gingrich/Santorum
Version: 17
Obama/Clinton vs Palin/Gingrich
Version: 16
Obama/Bill Richardson vs Gingrich/Barbour
With Richardson on the ticket millions of Latinos who don't normally vote come out to support him resulting in some surprising results.
Version: 15
Gingrich/Huntsman vs Obama/Clinton
Unemployment drops to 4% and Obama successfully attacks Iran and destroys their nuclear program and brings democracy to Syria and Iran. In other words best case scenario for Obama reelection prospects.
Version: 14
There is a long way to go but if Romney is the nominee and the economic situation stays about the same this will be my prediction for November. Romney taking New Hampshire, Michigan and the rogue Maine electoral vote (he has a very good chance of taking them all) will make it very difficult for Obama to win.
Version: 13
There is a long way to go but if Romney is the nominee and the economic situation stays about the same this will be my prediction for November. Romney taking New Hampshire, Michigan and the rogue Maine electoral vote (he has a very good chance of taking them all) will make it very difficult for Obama to win.
Version: 12
Romney/? vs Obama/H.Clinton
With his campaign in trouble Obama boots Biden and picks Clinton. With her and former President Bill Clinton campaigning in the south they're able to peel some southern states to compensate for the states Romney is able to take in the north. Bill Clinton is still very popular in Arkansas, Kentucky, Missouri and Louisiana. Montana is the surprise state in the election; after almost going for Obama last time he's just able to get over the hump this time around.
Version: 11
Romney/? vs Obama/H.Clinton
Version: 10
With the Cain Interracial Sexual Attack Scandal in full swing this would be the map if the election were held today.
Version: 9
Cain has picked up some momentum.
Version: 8
Cain vs Obama - the Interracial Sexual Attack Scandal continues to take its toll on the CAin campaign, he is now winning only 20 electoral votes.
Version: 7
Cain vs Obama - with the Cain Sex Assault Scandal turning into a tidal wave he will lose easily if he faces Obama.
Version: 6
Bachmann-Cain vs Obama-Biden
Version: 5
Obama vs Romney assuming no major changes to the direction the country is currently heading. There is still a long time until the election so anything could happen, all projections right now are just snapshots of the time they're taken.
The percentages aren't accurate, the next projection will hace accurate ones and have the tossups listed.
Version: 4
3 way race
Romney R
Obama D
Palin I
With higher turnout for Republicans splitting the vote and lower turnout for Obama they will actually carry 15 states between them but Obama obviously wins easily in this scenario. Percentages are also off just so the colors are solid, the light blue/pink/green was hard on the eyes.
Version: 3
Romney/Christie vs Obama/Biden
Map reflecting the probable outcome of that race
Version: 2
Romney vs Obama prediction assuming Trump won't run and split the vote
Version: 1
With rumors of Trump running as an independent this map reflects a three way race with Trump and the Republican candidate splitting a lot of the vote.


 2012 President
 2006 U.S. Senate
 2004 President

