


|
Date of Prediction: 2012-10-13 Version:3
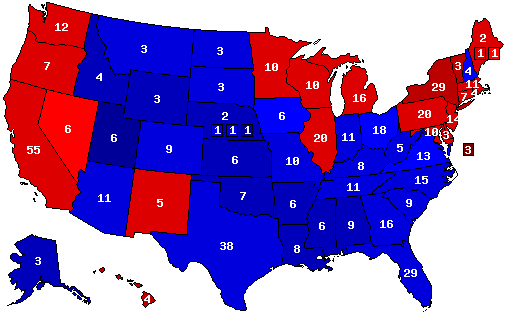
Prediction Map
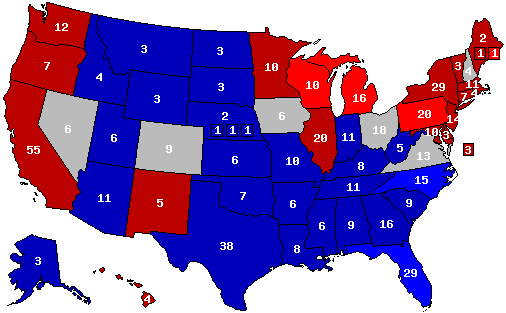
Confidence Map
Prediction States Won
Confidence States Won
State Pick-ups
Analysis
Assuming current RCP averages for well polled states, 538 adjusted averages for sparsely polled states&CDs, the last <=5% among those polled as undecided break 2:1 for Romney, and all others polled as undecided - if >5% - split evenly.
Prediction History
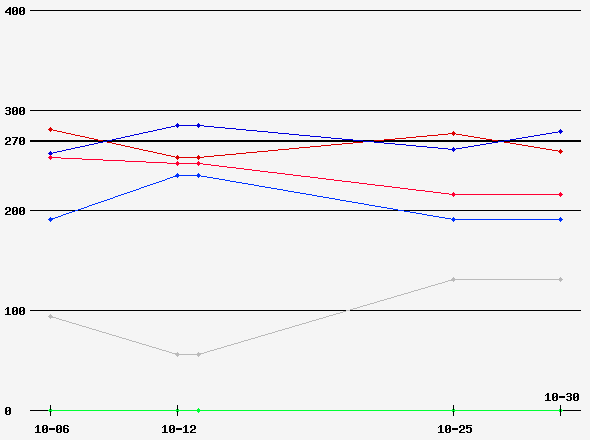
Comments History
- hide
Version: 4 2 week undecideds break 2:1 for the challenger Version: 3 Assuming current RCP averages for well polled states, 538 adjusted averages for sparsely polled states&CDs, the last <=5% among those polled as undecided break 2:1 for Romney, and all others polled as undecided - if >5% - split evenly. Version: 2 Assuming current RCP averages for well polled states, 538 adjusted averages for sparsely polled states&CDs, the last <=5% among those polled as undecided break 2:1 for Romney, and all others polled as undecided - if >5% - split evenly.
Version History Member Comments User's Predictions
User Info
Links
|
||||||||||||||||||||||||||||||||||||||||||||||||||||||||||||||||||||||||||||||||||||||||||||||||||||||||||||||||||||||||||||||||||||||||||||||||||||||||||||||||||||||||||||||||||
 2012 President
 2008 President
 2008 Senate
 2006 U.S. Senate
 2004 President


Back to 2012 Presidential Prediction Home - Predictions Home