Comments History
-
hideVersion: 6
Hello, USELECTIONATLASers!!!!
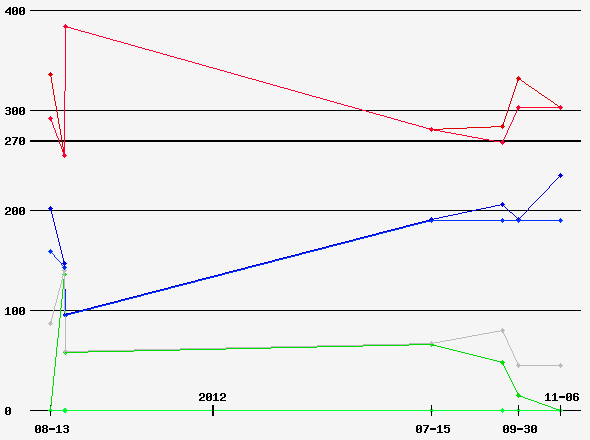
This is completely numbers generated prediction, based on my 4th Electoral Landscape Analysis from September 29, 2012. You can also read the analysis here POLITICAL HOTWIRE
The raw data for the analysis, including every single poll in 2012 to date, is HERE as an EXCEL TABLE.
This is a lengthy analysis and included the return of the "EVERYTHING TABLE", which I used in the analyses before and after the election of 2008.
To my knowledge, this kind of analysis is the most detailed of any on the net, anywhere.
Please go and read the analysis before commenting here and also enjoy familiarizing yourself with the EVERYTHING TABLE. It is most handy.
I want to remind again that this analysis is completely numbers generated. Why? Because I accept that every pollster, regardless whether left-or-right leaning or truly independent, will have a certain amount of mathematical bias in his or her calculations- that lies in the nature of the business, so to speak, and for that reason, I believe that the margin average of a "gene pool" of polling results is much closer to reality than most people want to admit. My stats work in both 2008 and 2004 proved this.
Also, in the tradition of 2008, I started the battleground reports at T-42 days in this year, Tuesday, September 25th. You can find them at my blog or at Political Hotwire.
Starting tonight, I will be linking here to each battleground report and national polling outlook (also published nightly, since 09/13).
Of interest to all, but maybe even more so to CONSERVATIVES here in uselectionatlas, I have started a RED STATE REPORT series in 2012. The analysis is HERE.
Here a quick summary of the RED STATE REPORT, based on the many numbers there to see:
Mitt's numbers look very good in 23 states (the 22 "McCain" states + IN) and in some, he is very likely to surpass McCain's record from 2008. In fact, I think there will be more GOP "swings" this year, especially in states that Obama will still win. And I suspect that Mitt will set an all-time record in UTAH and surpass William Jennings Bryan's massive +82.70% MARGIN from 1896. If not, he is sure to surpass Reagan's +52.20% margin from 1980. The report is, as usual, totally neutral, but the numbers there are telling a distinct story: that the CORE GOP territory is absolutely intact, but parts of the breadbasket and blue sky regions are not swinging back to the incredible margins of Bush 2004 (Reagan 1980, 1984 - Nixon 1972, Eisenhower 1952, 1956). On the other hand, Missouri is moving deep, deep, deep into GOP territory, which means it will probably not be a good bellwether state anymore. And I bet that Romney will score his highest southern state landslide in Arkansas. So, regardless of the outcome on November 6th, Romney will still be shifting a lot of the map to be more GOP friendly - in spite of losing - if he loses, just as Kerry did for the DEMS in 2004 (i.e., CO, VA).
Mitt's problem is that he can barely break over 44% in most, if not all, of the battlegrounds. And to have this problem still six weeks away from the GE... well...
best,
bonncaruso
Version: 5
This is completely numbers generated, based on my 3rd Electoral Landscape Analysis from September 15, 2012.
The raw data for the analysis, including every single poll in 2012 to date, is HERE as an EXCEL TABLE.
This is a lengthy analysis and included the return of the "EVERYTHING TABLE", which I used in the analyses before and after the election of 2008.
No need to say anything else. Please go and read the analysis before commenting here and also enjoy familiarizing yourself with the EVERYTHING TABLE. It is most handy.
best,
bonncaruso
Version: 4
The complete analysis is HERE AT BLOGSPOT -or- HERE AT POLITICAL HOTWIRE.
The link to the EXCEL document contain all poll data for 2012 is at both links.
Please read the complete analysis before commenting. As usual, I am non-partisan and brutally fair when it comes to electoral statistics, just as was the case in 2008.
Questions? You can also email me HERE
Version: 3
BONNCARUSO's ELECTORAL LANDSCAPE MAP for 2012: THE OFFICIAL START
The first map of mine was just for fun. I promised that the next maps would be serious.
This map, map no. 3, is supposed to go with the former map, map. no. 2, which is here. They function as a pair.
This is all based on cut-and-dried poll data, which is a Bonncaruso hallmark from 2008 and to a lesser degree, from 2010.
The former map: Map no. 2 is "Obama vs. Romney"
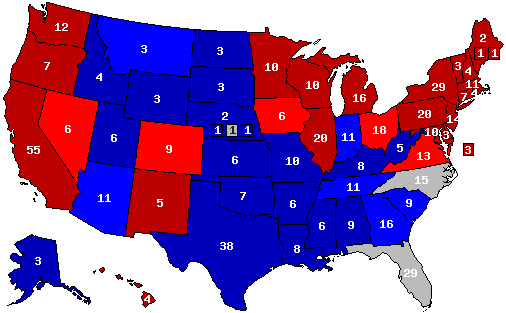
This map: Map no. 3 is "Obama vs. not-Romney"
I have already put out a very large analysis, including all raw numbers and BOTH MAPS presented together, which you can find here at my politics blog or here at "Political Hotwire". All the data you need is there, and then some to boot - and of course presented in an impassionate fashion. Also, the reasoning for why at this time INDIANA is a tossup-state in both maps is presented there. Go read it.
In the analysis, there are hyperlinks to get you to the raw data and within the data tables themselves, everything is hyperlinked so you can see the original stuff for yourself.
I strongly encourage you to first click on one of the above links and read the ENTIRE report before going on.
-----------------------------------------------
Again, to emphasize: these two maps are not based on emotion or personal preference, but rather, they are purely a result of the data at hand. In other words, I make no justification or excuses for why something is the way it is in order to make someone think it should be a different way. I simply work with the numbers that are currently available. And the state presidential polling numbers that are there, in conjunction with national polling and presidential approval numbers, GOP nomination numbers and GOP candidate approval numbers - these numbers tells 2 stories. And they go something like this:
1.) In the event that Romney is not nominated, Obama wins in a large landslide against any of the declared GOP candidates, with an average of at least +11%. This is fascinating, as I wrote many many times in 2008 and in 2010 that statistically, when you average it out, an incumbent who has won (and that is most of them) generally added between 2%-4% to his winning percentage and between 3%-7% to his margin. A +11% win in 2012 would be roughly a +4% margin increase, right within the norm of presidential re-election statistics.
So, based on the current data at hand, it is:
Obama 384 EV
"not"-Romney 96 EV
"tossup" 158 EV
Margin: Obama +288
Needed to get to 270: Obama 0, not-Romney, +174 (impossible to achieve)
Statistically, it is so that in this case Obama has an automatic clinch on the EC. This was also the case with Reagan in 1984, Nixon in 1972, Johnson in 1964, Eisenhower in 1956, FDR in 1932 and 1936, just to go back 70 years. It almost never is light for a contender against an incumbent. The electoral history of our Union proves makes this point in very stark terms.
2.) We are witnessing a severe numeric disconnect within the Republican party between whom they think can beat Obama in November 2012 and whom they would prefer as nominee in terms of their ideology, which is why either Perry or Bachmann both have a chance at taking the nomination from Romney. Perry obviously has the better chance right now. And since polling numbers have proven over and over and over again that the GOP has tacked very hard to the right as it has shrunk in size and now has a much larger, extreme-conservative base in relation to the rest of the party, and since Romney is not perceived as being conservative, the chances of ditching a perceived moderate for a perceived conservative are large. I put the chances of a moderate being selected for the GOP presidential or vice-presidential nomination at exactly 0%.
Were this to happen then it would be the first time in a long time that the GOP has not followed the "next in line" principle for selecting a nominee. Actually, in terms of delegates, Huckabee was no. 2 from 2008, but he elected to not run, which means that Romney is logically next in line.
For this reason I am now beginning to follow the GOP nomination polls closely and have already provided a massive and helpful GOP nomination calendar, which you can look at here.
It is possible that someone will want to bring up the point, asking why I have not made an Obama-Perry map. The point is a good one and my answer is simple: not enough state-by-state data to go on, but surely polling in the next 2-4 months will cure that problem. But as long as Perry is down between -8 and -10 in the polls, I don't expect much of the electoral map from 2008 to shift to the GOPs favor...
One factor I have also completely ignored in both maps have been the CDs in both NE and ME. Quite obviously, were Obama to win in a large landslide, then the chances would be very strong that we would definitely capture all the CDs in ME and probably NE-02 once again. But since there is absolutely no data about this (see: IN), for now I am assuming straight up and down WTA wins in both of those state.
-------------------------------------------
And now, a little homework for all of you: go to my politics blog and click on the link for the raw data. Or you can click here. Go through the 36 states that have polling data. Which state have I ignored vis-a-vis polling data and why? In other words, I have left this state firmly in the GOP column despite data showing a possible Obama win. This little exercise is good for training the eyes. :) :)
---------------------------------------------------
So, have fun and keep it polite and sane, please.
-------------------------------------------------
N4mb3rz: Math triumphs over propaganda.
I used to be psychzophrenic, but now we are all doing just fine..........................
bonncaruso email
Skype, windows live, aol: bonncaruso
Version: 2
BONNCARUSO's ELECTORAL LANDSCAPE MAP for 2012: THE OFFICIAL START
The first map of mine was just for fun. I promised that the next maps would be serious.
This map, map no. 2, is supposed to go with the next map, map. no. 3, which is here. They function as a pair.
This is all based on cut-and-dried poll data, which is a Bonncaruso hallmark from 2008 and to a lesser degree, from 2010.
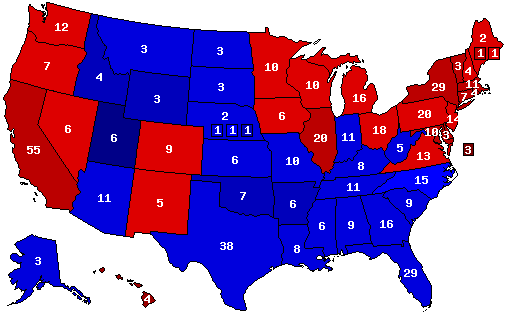
Map no. 2 is "Obama vs. Romney"
Map no. 3 is "Obama vs. not-Romney"
I have already put out a very large analysis, including all raw numbers and BOTH MAPS presented together, which you can find here at my politics blog or here at "Political Hotwire". All the data you need is there, and then some to boot - and of course presented in an impassionate fashion. Also, the reasoning for why at this time INDIANA is a tossup-state in both maps is presented there. Go read it.
In the analysis, there are hyperlinks to get you to the raw data and within the data tables themselves, everything is hyperlinked so you can see the original stuff for yourself.
I strongly encourage you to first click on one of the above links and read the ENTIRE report before going on.
-----------------------------------------------
Again, to emphasize: these two maps are not based on emotion or personal preference, but rather, they are purely a result of the data at hand. In other words, I make no justification or excuses for why something is the way it is in order to make someone think it should be a different way. I simply work with the numbers that are currently available. And the state presidential polling numbers that are there, in conjunction with national polling and presidential approval numbers, GOP nomination numbers and GOP candidate approval numbers - these numbers tell two stories. And they go something like this:
1.) All statewide and national polling data shows that AT THIS TIME, Mitt Romney (R) fares far better against Barack Obama (D-Inc) than any other prospective GOP candidate for the presidency in 2012. A Mitt Romney nomination, using the current numbers, moves NH back into the lean GOP column, it puts four DEM pick-up states (NV, IN, OH, FL) and one DEM long time retention (PA) into serious battleground play, but it also places 3 GOP retention states (AZ, MO and GA) into play. Those nine states are colored in GREEN on this map. They do not indicate a third party candidate, but rather, "tossup-battleground" status. In a Obama-Romney scenario, these nine states would decide the 2012 election, according to current statistics.
So, based on the current data at hand, it is:
Obama 255 EV
Romney 147 EV
"tossup" 136 EV
Margin: Obama +108
Needed to get to 270: Obama +15, Romney +123
Statistically, it is so that Obama has the stronger start in the EC. This is not uncommon for an incumbent president to start in this position. It also means that strategically speaking, Obama needs to retain less of his historically unique EV map from 2008 in order to get re-elected. The fact that he has won every single match-up in every single poll for both OH and VA and 41 out of 46 matchups in NC shows that Mitt Romney can make it close, but getting to 270 will not be light for him. It almost never is light for a contender against an incumbent. The electoral history of our Union proves makes this point in very stark terms.
2.) The man most likely to provide the hardest challenge to Obama may not get the nomination. Rick Perry's sudden jump to the top of GOP national and statewide nominating polls within just one week of formally announcing means that Romney is statistically in 2nd place and will have to campaign hard to regain front runner status. What we are witnessing is a severe numeric disconnect within the Republican party between whom they think can beat Obama in November 2012 and whom they would prefer as closer to their ideology. And since polling numbers have proven over and over and over again that the GOP has tacked very hard to the right as it has shrunk in size and now has a much larger, extreme-conservative base in relation to the rest of the party, and since Romney is not perceived as being conservative, it is first an issue of seeing who will ultimately be nominated. For this reason I am now beginning to follow the GOP nomination polls closely and have already provided a massive and helpful GOP nomination calendar, which you can look at here.
It is possible that someone will want to bring up the point, asking why I have not made an Obama-Perry map. The point is a good one and my answer is simple: not enough state-by-state data to go on, but surely polling in the next 2-4 months will cure that problem.
So, this is the Obama-Romney map, and map no. 3 is the Obama vs. anyone-but-Romney.
So, have fun and keep it polite and sane, please.
-------------------------------------------------
N4mb3rz: Math triumphs over propaganda.
I used to be psychzophrenic, but now we are all doing just fine..........................
bonncaruso email
Skype, windows live, aol: bonncaruso
Version: 1
Well, Bonncaruso is BACK, ladies and gentlemen.
This is just a starter map, for kicks. It is not intended to be serious, quite yet.
No deep analysis - YET.
Imagine Obama losing PA, OH and IN and still winning by keeping the rest and picking up GA and AZ.
Make no doubt about it, this election is still Obama's to lose, not the other way around. Seeing the clowns masquerading as the GOP field only confirms my suspicion that it will be a rout for the GOP in 2012 and Barack Obama, that socialist, communist, Kenyan, short-form, long-form usurper, will be re-elected as POTUS.
I will be publishing a map based on currently polling at the end of August. And some humourous maps similar to 2008 are SURE to happen :) :)
Have fun and remember, be nice, or I will zap you with my X-21 Space Modulator with Death Ray (Wet Bar and naked blondes included for a surcharge).
---------------------
You can also find me at POLITICAL HOTWIRE or at my personal politics blog. If you go to either, you will find some fascinating current statistics on Voter Registration and Party Affiliation.


 2014 Senate
 2012 President
 2010 Senate
 2008 President
 2008 Senate
 2008 Dem Primary
 2008 Rep Primary


