


Note: The Google advertisement links below may advocate political positions that this site does not endorse.
|
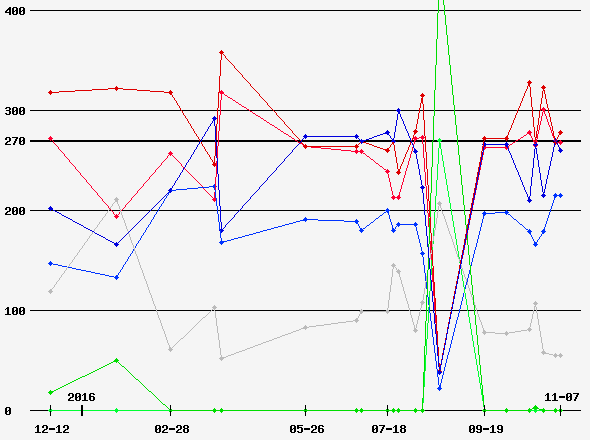
Date of Prediction: 2016-07-25 Version:11
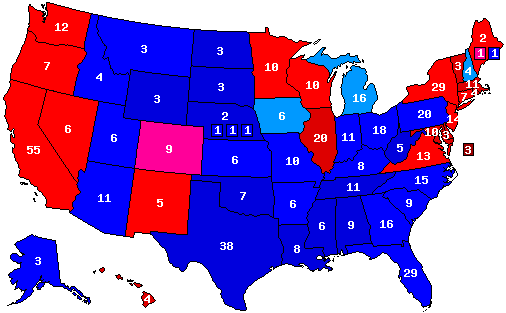
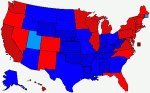
Prediction Map
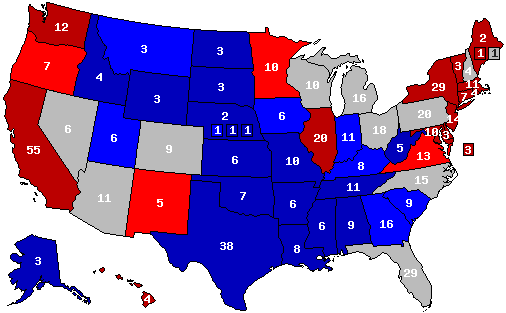
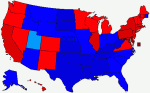
Confidence Map
Prediction States Won
Confidence States Won
State Pick-ups
Analysis
The Hillary special: snatching defeat from the jaws of victory.
Prediction History
Comments History
- show
Version History Member Comments
User's Predictions
Links
|
|||||||||||||||||||||||||||||||||||||||||||||||||||||||||||||||||||||||||||||||||||||||||||||||||||||||||||||||||||||||||||||||||||||||||||||||||||||||||||||||||||||||||||||||||||||||||||||||||||||||||||||||||||||||||||||||||||||||||||||||||||||||||||||||||||||||||||||||||||||||||||||||||||||||||||||||||||||||||||||||||||||||||||||||||||||||||

 2020 President
 2020 Senate
 2018 Senate
 2018 Governor
 2016 President
 2016 Senate
 2016 Governor
 2014 Senate
 2014 Governor
 2012 President
 2012 Senate
 2012 Rep Primary
 2010 Senate
 2010 Governor
 2008 President
 2008 Senate
 2008 Governor
 2008 Dem Primary
 2008 Rep Primary


Back to 2016 Presidential Prediction Home - Predictions Home
© Dave Leip's Atlas of U.S. Elections, LLC 2019 All Rights Reserved