


Note: The Google advertisement links below may advocate political positions that this site does not endorse.
|
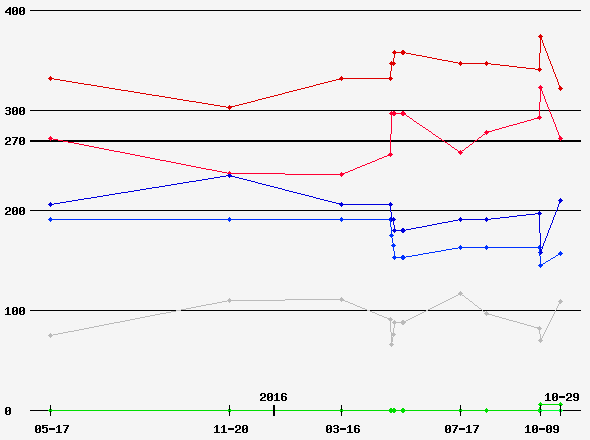
Date of Prediction: 2016-10-29 Version:14
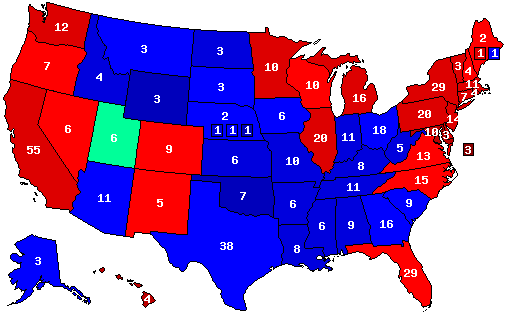
Prediction Map
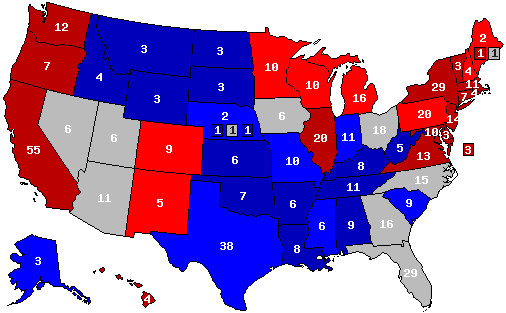
Confidence Map
Prediction States Won
Confidence States Won
State Pick-ups
Prediction Score (max Score = 112)
Analysis
Looked over every contest today. Between Johnson's expectable collapse and the slight pullback in Clinton's fortune, my map is looking rosier for Trump, but still not rosy enuf to be a win, just not as crushing a defeat as it could have been for him. Last time Utah in the I column was a placeholder for Trump 20%, now it truly is McMullin 30%.
Prediction History
Comments History
- show
Version History Member Comments User's Predictions
User Info
Links
|
|||||||||||||||||||||||||||||||||||||||||||||||||||||||||||||||||||||||||||||||||||||||||||||||||||||||||||||||||||||||||||||||||||||||||||||||||||||||||||||||||||||||||||||||||||||||||||||||||||||||||||||||||||||||||||||||||||||||||||||||||||||||||||||||||||||||||||||||||||||||||||||||||||||||||||||||||||||||||||||||||||||

 2020 President
 2020 Senate
 2018 Senate
 2016 President
 2016 Senate
 2013 Governor
 2012 President
 2012 Senate
 2012 Governor
 2012 Rep Primary
 2010 Senate
 2010 Governor
 2009 Governor
 2008 President
 2006 U.S. Senate
 2006 Governor
 2004 President


Back to 2016 Presidential Prediction Home - Predictions Home
© Dave Leip's Atlas of U.S. Elections, LLC 2019 All Rights Reserved