


|
Date of Prediction: 2016-10-14 Version:2
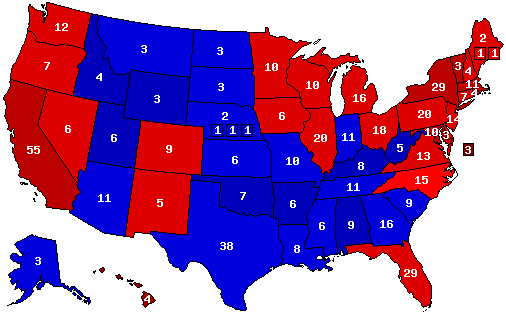
Prediction Map
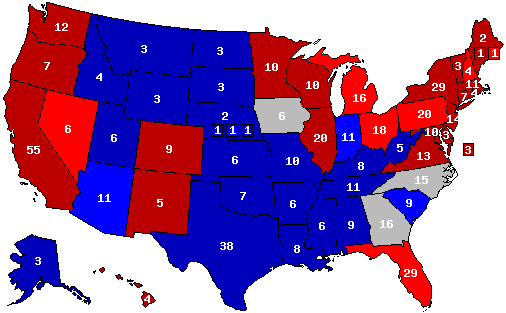
Confidence Map
Prediction States Won
Confidence States Won
State Pick-ups
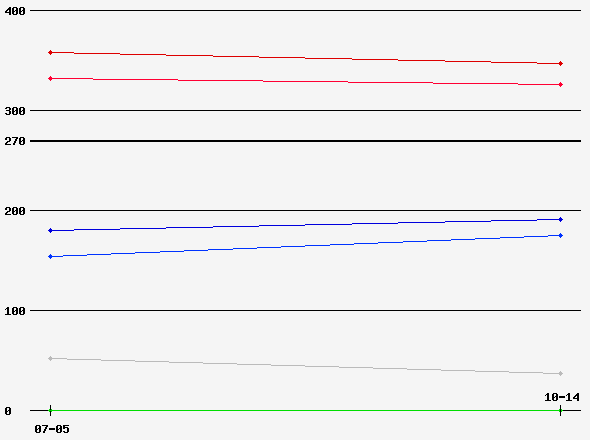
Prediction Score (max Score = 112)
Analysis
First update in a long time, at Hillary's lowest points I've been too frustrated to update to reflect a closer race. As expected however, the race has maintained its status quo of a large Clinton win.<br /> <br /> Some adjustments made in this update. Trump clearly leads in Arizona, though I still think it could be in play, Clinton's odds there currently do not appear reasonable to leave it in the tossup leaning Clinton category, it is neither. Missouri has never really looked winnable for Clinton in this race and therefore shifts away from tossup because it is not. Iowa shifts to "tossup" as Trump is clearly inordinately strong there compared to his weakness nationally.<br /> <br /> I've dropped Trump's percentage in Utah because they clearly don't really like him, but it's not at all in play, I may drop it more in the future if I start to feel like 3rd parties may play a role there, McMullen in particular. Shifts in the percentage won't likely reflect changes in win probability there. Georgia now appears to be the traditionally Republican State most likely to go Clinton, followed by Arizona, South Carolina, Missouri, Texas, and Utah.
Prediction History
Comments History
- show
Version History Member Comments User's Predictions
Links
|
||||||||||||||||||||||||||||||||||||||||||||||||||||||||||||||||||||||||||||||||||||||||||||||||||||||||||||||||||||||||||||||||||||||||||||||||||||||||||||||||||||||||||||||||||||||||||||||||||||||||||||||||||||||||||||||||||||||||||||||||||||||||||||||||||||||||||||||||||||||||||||||||||

 2020 President
 2020 Senate
 2016 President
 2016 Senate
 2014 Senate
 2012 President
 2012 Senate
 2010 Senate
 2010 Governor
 2008 President
 2008 Senate
 2008 Governor
 2006 U.S. Senate
 2006 Governor


Back to 2016 Presidential Prediction Home - Predictions Home