


Note: The Google advertisement links below may advocate political positions that this site does not endorse.
|
Date of Prediction: 2016-05-20 Version:17
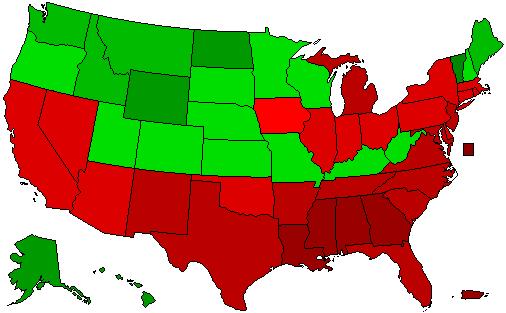
Prediction Map
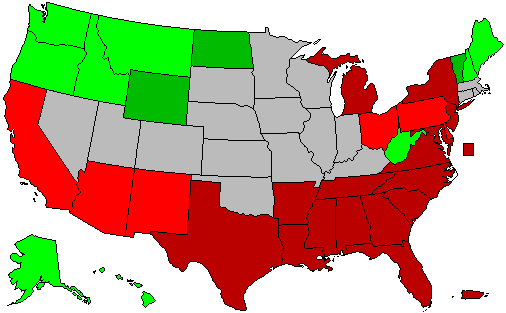
Confidence Map
Prediction States Won
Confidence States Won
Analysis
Probably my last update for the Dems:<br /> <br /> Clinton is strongly favored in PR, DC, NJ, and NM<br /> Sanders is strongly favored in ND and MT<br /> <br /> Clinton is favored in CA and Sanders in SD, which will make June 7th rather anti-climatic after all is said and done. Clinton will informally clinch the nomination with the win in NJ, and will formally win a majority of pledged delegates later in the day with the win in CA.
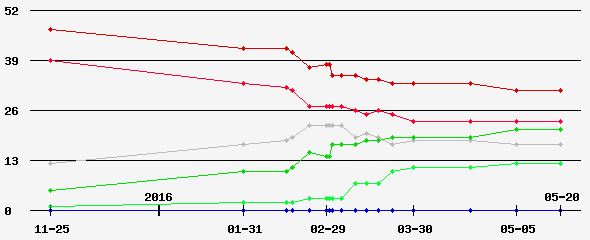
Prediction History
Comments History
- show
Version History Member Comments User's Predictions
Links
|
|||||||||||||||||||||||||||||||||||||||||||||||||||||||||||||||||||||||||||||||||||||||||||||||||||||||||||||||||||||||||||||||||||||||||||||||||||||||||||||||||||||||||||||||||||||||||||||||||||||||||||||||||||||||||||||||||||||||||||||||||||||||||||||||||||||||||||||||||||||||||||||||||||||||||||||||||||||||||||||||||||||||||||||||||||||||||||||||||||||||||||||||||||||||||||||||||||||||||||
 2022 Senate
 2022 Governor
 2020 President
 2020 Senate
 2020 Governor
 2019 Governor
 2018 Senate
 2018 Governor
 2016 President
 2016 Senate
 2016 Governor
 2015 Governor
 2014 Senate
 2014 Governor
 2013 Governor
 2012 President
 2012 Senate
 2012 Governor
 2012 Rep Primary
 2010 Senate
 2010 Governor
 2008 President
 2008 Senate
 2008 Governor
 2006 U.S. Senate
 2006 Governor
 2004 President


Back to 2016 Democratic Presidential Primary Prediction Home - Predictions Home
© Dave Leip's Atlas of U.S. Elections, LLC 2019 All Rights Reserved