Comments History
-
hideVersion: 6
Switched NJ and TN.
Version: 4
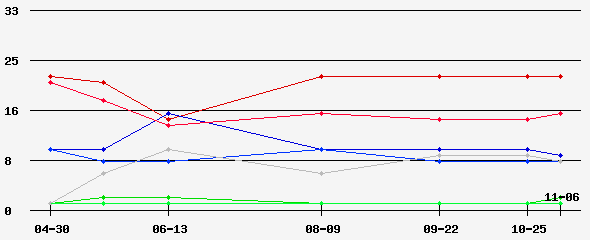
Since the last update, the tide has apparently shifted again toward the Dems on both a macro (RD/WT numbers, Bush approval, generic ballot) and micro (individual race polls, NPR poll, and others) level. Moreover, the anti-incumbant mode and surly electorate has finally shown itself on a federal level, with 3 incumbants losing last night.
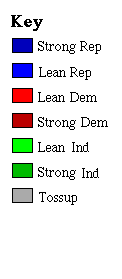
As noted in the last update, in recent history toss-up Senate races have overwhelmingly been won by one party - so I am giving most of those to the Dems right now. I rate PA, Montana, and RI as leaning D (RI may suffer a similar fate at CT), with OH and MO likely to switch now, but who knows what may happen in the next month.
Potential Dem surprises would be NV and AZ (I think Dem long-term prospects are better here than in the south (VA and TN) where have recently been coming up short).
The best opportunities for Rep surprises/pickups are Washington (energized Republicans because of 2004 Gov race), New Jersey, and Nebraska (same reasoning as last time.
Lastly, I have moved Connecticut back to Dem. Even though I was one of the first to predict (aka: jump-on-the-bandwagon) a Leiberman independent candidacy months ago -- the loser/sore-loser image and rallying of elected Dems around Lamont will probably result in Leiberman dropping out.
Version: 3
There seem to be several indicators that the playing field is shifting against the Dems:
* Dem overconfidence that they will win the election big (as noted in recent Cook article)
* Low primary turnouts suggesting there aren't a lot of angry voters rushing to the polls (perhaps to alienated or apathetic)
* Dem inability to turnout in CA 50 -- corruption message may not work
* Reps superior ground game and ability to get voters to vote absentee.
* Sense that Bush popularity may have bottomed out - may give Reps some momentum thru the summer.
As a result, I am moving my rankings to reflect the Reps taking most of the tossups instead of the Dems. Recall that historically (at least over the last several elections) the tossup races have overwhelmingly fallen toward one party (Rep in 2004 and 2002; Dem in 2000 and 1998), which suggests either a Rep gain of 2 or 3 seats, or a Dem gain of 5 or 6 seats.
On specific races, I'm going out on a limb with Nebraska, but if there is any type of Rep swing in this election, this seat could be the big surprise (plus Nelson's history of losses/near losses in the state).
Version: 2
Based on Lamont's strong showing at the convention, I've jumped on the Lieberman-as-an-Independent bandwagon.


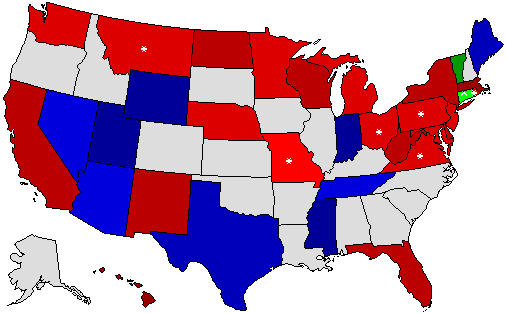
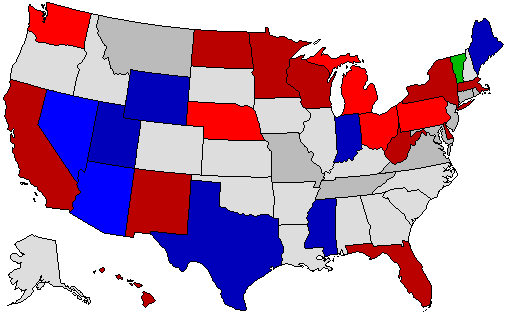
 2018 Senate
 2018 Governor
 2016 President
 2016 Senate
 2016 Governor
 2014 Senate
 2014 Governor
 2013 Governor
 2012 President
 2012 Senate
 2012 Governor
 2011 Governor
 2010 Senate
 2010 Governor
 2008 President
 2008 Senate
 2008 Governor
 2007 Governor
 2006 U.S. Senate
 2006 Governor