


|
Date of Prediction: 2006-11-06 Version:5
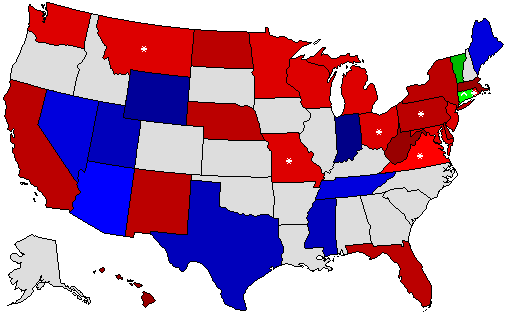
Prediction Map
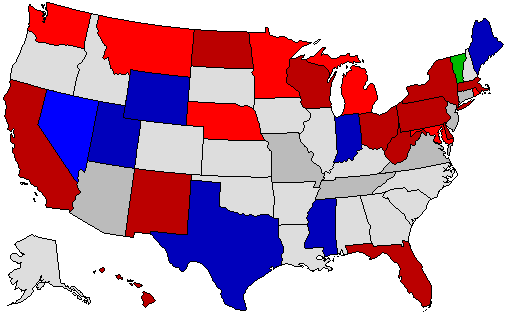
* = Pickup via defeat of incumbent; ^ = Pickup of an open seat Confidence Map
Prediction States Won
Confidence States Won
State Pick-ups
Predicted Senate Control (110th Congress):
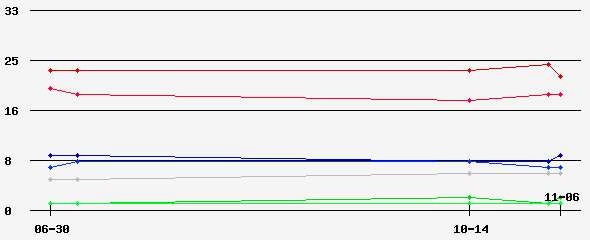
Prediction Score (max Score = 66)
Comments
Last update before the election. I still think there's about a 5% chance Tennessee could go for Ford, but I am not as hopeful as I was even two days ago. Everything else I think is pretty much in line with what all polling is showing.
Prediction History
Comments History
- hide
Version: 2 I haven't changed much since last time, the major change being Connecticut. If Lieberman looses the primary and runs as an independent, I don't think he'll have the smooth sailing that many seem to think, and he'll face a deserved backlash among Democrats, as well as a lack of DSCC money. I put Connecticut as a slim Lamont win in the general simply because he can paint Lieberman as the imperial senator who ignores the will of the people.
Version History Member Comments User's Predictions
Links
|
|||||||||||||||||||||||||||||||||||||||||||||||||||||||||||||||||||||||||||||||||||||||||||||||||||||||||||||||||||||||||||||||||||||||||||||||||||||||||||||||||||||||||||||||||||||||||||||||||||||||||||||||||||||||||||||||||||||||||||||||||||||||||||||||||||||||||||||||||||||||||||||||||||||||||||||||||||||||||||||||||||||||
 2016 President
 2016 Senate
 2016 Governor
 2012 President
 2012 Senate
 2012 Governor
 2008 President
 2008 Senate
 2008 Governor
 2008 Dem Primary
 2008 Rep Primary
 2007 Governor
 2006 U.S. Senate
 2006 Governor
 2004 President
Back to 2006 Senatorial Prediction Home - Predictions Home