


Note: The Google advertisement links below may advocate political positions that this site does not endorse.
|
Date of Prediction: 2022-11-07 Version:1
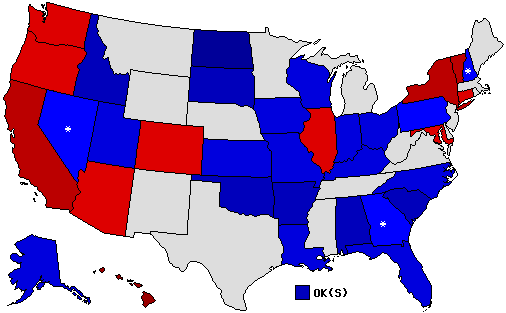
Prediction Map
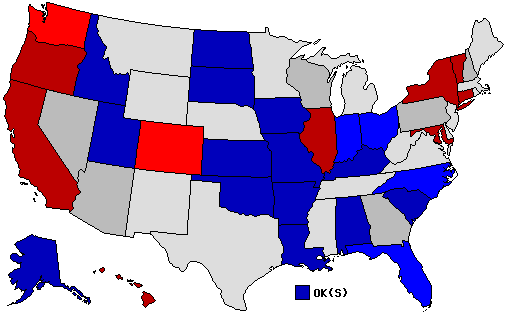
* = Pickup via defeat of incumbent; ^ = Pickup of an open seat Confidence Map
Prediction States Won
Confidence States Won
State Pick-ups
Predicted Senate Control (118th Congress):
Prediction Score (max Score = 70)
Analysis
Small red wave carries GOP candidates in many narrow races. <br /> Nevada: seems to be a purple state with some GOP momentum.<br /> Arizona: Dem hold on due to changing demographics in favor of Dems.<br /> Penn.: Oz wins narrowly due to Fetterman debate debacle and overall national momentum.<br /> Georgia: Likely goes to a runoff. Narrow Walker win due to GOP momentum (despite running a bad campaign).<br /> New Hampshire: I am truly uncertain about this one and just gave an educated guess.<br /> Wisconsin: Inflation issue drives working class voters here more towards the GOP. Member Comments User's Predictions
Links
|
|||||||||||||||||||||||||||||||||||||||||||||||||||||||||||||||||||||||||||||||||||||||||||||||||||||||||||||||||||||||||||||||||||||||||||||||||||||||||||||||||||||||||||||||||||||||||||||||||||||||||||||||||||||||||||||||||||||||||||||||||||||||||||||||||||||||||||||||||||||||||||||||||||||||||||||||||||||||
 2022 Senate
 2020 President
 2018 Senate
 2016 President
 2016 Senate
 2014 Senate
 2012 President
 2012 Senate
 2010 Senate
 2008 President
 2006 U.S. Senate
 2006 Governor
 2004 President


Back to 2022 Senatorial Prediction Home - Predictions Home
© Dave Leip's Atlas of U.S. Elections, LLC 2019 All Rights Reserved