Home
2024
Election Results
Election Info
Weblog
Forum
Wiki
Search
Email
Login
Site Info
Store
1978 Senatorial Democratic Primary Election Results - Oregon
Note: The Google advertisement links below may advocate political positions that this site does not endorse.
Data for this Contest was Contributed by on 2023-05-27
Senatorial
Candidate
Political
Party
Popular Vote
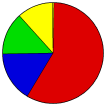
Vern Cook
Democratic
151,754
58.32%
John Sweeney
Democratic
41,599
15.99%
Jack A. Brown
Democratic
35,211
13.53%
Steve Anderson
Democratic
30,066
11.56%
Write-ins
-
1,567
0.60%
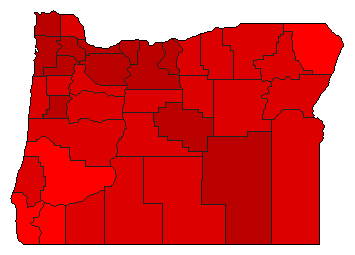
Map Key
> 40%
> 50%
> 60%
> 70%
Turnout
Maps
Pop. (m)
Demographic Data
1980 Population:
2,633,156
Enum.
1980 Population Density:
10.6
persons/km
2
1978 Population:
0
Est.
1978 Population Density:
0.0
persons/km
2
1970 Population:
2,091,533
Enum.
1970 Population Density:
8.4
persons/km
2
Land Area (2000):
248,631
km
2
Annual Pop Growth Rate:
2.3
%
Election Data and Statistics:
County Data (Table)
(m)
County Data (Graphs)
Purchase Detailed Data
Compare State Maps by Year
View All 1978 Oregon Maps
Election Tools
Atlas Forum
Image Code for Maps:
County
,
Pop
Data Sources:
Source for Popular Vote data: Oregon Secretary of State.
Official Abstract of Votes Primary Election May 23, 1978
, Oregon Secretary of State (http://records.sos.state.or.us/ORSOSWebDrawer/RecordView/8411047) (accessed 27 May 2023)
Source for Population data: U.S. Census Bureau.
Results for and Individual County:
(m)
Choose Year
2022
2020
2016
2014
2010
2008
2004
2002
1998
1996
1992
1990
1986
1984
1980
1974
1972
1968
1966
1962
1960
1956
1950
Choose Office
Governor
Choose State
Arkansas
Illinois
Massachusetts
New Jersey
Oklahoma
Oregon Election Results Home
-
National Results for 1978
-
Use Frame Navigation
Login
Terms of Use
-
DCMA Policy
-
Privacy Policy and Cookies
©
Dave Leip's Atlas of U.S. Elections, LLC 2019 All Rights Reserved


