| |
Gubernatorial
Candidate | Lt. Gubernatorial
Candidate | Political
Party | Popular Vote |
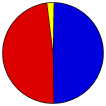
 | Christine Todd Whitman | - | Republican |
1,236,124 |
49.33% |
 | James Florio | - | Democratic |
1,210,031 |
48.29% |
 | Pat Daly | - | Independent |
10,071 |
0.40% |
| Kenneth R. Kaplan | - | Independent |
7,935 |
0.32% |
| Tom Blomquist | - | Independent |
5,164 |
0.21% |
| Joseph Marion | - | Independent |
4,311 |
0.17% |
| Richard J. Lynch | - | Independent |
4,030 |
0.16% |
| Arlene S. Ammond | - | Independent |
3,330 |
0.13% |
| Tim Feeney | - | Independent |
3,306 |
0.13% |
| Michael R. Scully | - | Independent |
3,209 |
0.13% |
| Pete Di Lauro | - | Independent |
3,009 |
0.12% |
| Marilyn Arons | - | Independent |
2,884 |
0.12% |
| John L. Kucek | - | Independent |
2,822 |
0.11% |
| Tom Fuscaldo | - | Independent |
2,314 |
0.09% |
| Michael Ziruolo | - | Independent |
2,127 |
0.08% |
| Andrew J. Zemel | - | Independent |
1,530 |
0.06% |
| Andrea Lippi | - | Independent |
1,294 |
0.05% |
| Mark J. Rahn | - | Independent |
1,242 |
0.05% |
| Jerry T. Grant | - | Independent |
1,231 |
0.05% |
 |
Map Key
| Turnout
 |  |
|
| Maps | 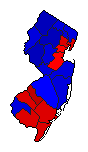 |  | | Pop. (m) | | Rep. (m) | | Dem. (m) |
| |
| Demographic Data
| 2000 Population: | 8,414,350 | Enum. | 2000 Population Density: | 438.0 | persons/km2 | | 1993 Population: | 7,948,915 | Est. | 1993 Population Density: | 413.8 | persons/km2 | | 1990 Population: | 7,747,750 | Enum. | 1990 Population Density: | 403.3 | persons/km2 | | Land Area (2000): | 19,211 | km2 | Annual Pop Growth Rate: | 0.8 | % |
| Election Data and Statistics:
| Election Tools
- Atlas Forum Image Code for Maps: County, Pop
Data Sources:
- Source for Popular Vote data: New Jersey Department of Law and Public Safety. Division of Elections, Official List Gubernatorial General Election Returns by County For Election Held November 2, 1993 (Trenton, 1993)
- Source for Population data: U.S. Census Bureau.
| Results for and Individual County:
|
|
| |


