Home
2024
Election Results
Election Info
Weblog
Forum
Wiki
Search
Email
Login
Site Info
Store
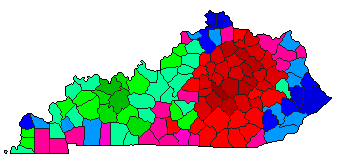
1998 Senatorial Democratic Primary Election Results - Kentucky
Note: The Google advertisement links below may advocate political positions that this site does not endorse.
Data for this Contest was Contributed by on 2007-02-03
Senatorial
Candidate
Political
Party
Popular Vote
Scotty Baesler
Democratic
194,125
34.16%
Charlie Owen
Democratic
166,472
29.29%
Steve L. Henry
Democratic
156,576
27.55%
James Henry (Jim) Brown
Democratic
19,975
3.51%
David L. Williams
Democratic
16,366
2.88%
Ken Buchanan Thompson
Democratic
14,778
2.60%
Map Key
> 20%
> 30%
> 40%
> 50%
> 60%
> 70%
Turnout
Maps
Pop. (m)
Demographic Data
2000 Population:
4,041,769
Enum.
2000 Population Density:
39.3
persons/km
2
1998 Population:
3,985,390
Est.
1998 Population Density:
38.7
persons/km
2
1990 Population:
3,686,892
Enum.
1990 Population Density:
35.8
persons/km
2
Land Area (2000):
102,896
km
2
Annual Pop Growth Rate:
0.9
%
Election Data and Statistics:
County Data (Table)
(m)
County Data (Graphs)
Purchase Detailed Data
Compare State Maps by Year
View All 1998 Kentucky Maps
Election Tools
Atlas Forum
Image Code for Maps:
County
,
Pop
Data Sources:
Source for Popular Vote data: Kentucky Secretary of State.
1998 Primary Election Results
, Kentucky Secretary of State (http://elect.ky.gov/NR/rdonlyres/8A101B6D-0DD6-4730-9524-10CDED792DCC/0/USSenate.pdf) (accessed 03 Feb 2007)
Source for Population data: U.S. Census Bureau.
Results for and Individual County:
(m)
Choose Year
2016
2014
2010
2008
2004
2002
1996
1990
Choose Office
Choose State
Arkansas
Colorado
Georgia
Kansas
Missouri
North Carolina
Oklahoma
Oregon
Washington
Kentucky Election Results Home
-
National Results for 1998
-
Use Frame Navigation
Login
Terms of Use
-
DCMA Policy
-
Privacy Policy and Cookies
©
Dave Leip's Atlas of U.S. Elections, LLC 2019 All Rights Reserved


