| |
Presidential
Candidate | Home State | Political
Party | Primary Vote | Delegates |
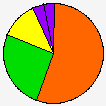
 | Rick Santorum | Virginia | Republican |
139,272 |
55.23% | 0 | 0.0% |
 | Mitt Romney | Massachusetts | Republican |
63,882 |
25.33% | 0 | 0.0% |
 | Ron Paul | Texas | Republican |
30,647 |
12.15% | 0 | 0.0% |
 | Uncommitted | - | Republican |
9,853 |
3.91% | 0 | 0.0% |
| Rick Perry | Texas | Republican |
2,456 |
0.97% | 0 | 0.0% |
| Herman Cain | Georgia | Republican |
2,306 |
0.91% | 0 | 0.0% |
| Michele Bachmann | Minnesota | Republican |
1,680 |
0.67% | 0 | 0.0% |
| Jon Huntsman, Jr. | Utah | Republican |
1,044 |
0.41% | 0 | 0.0% |
| Other (+) | - | Republican |
1,045 |
0.41% | 0 | 0% |
 | Unallocated | - | Republican |
- |
- | 52 | 100.0% |
 |
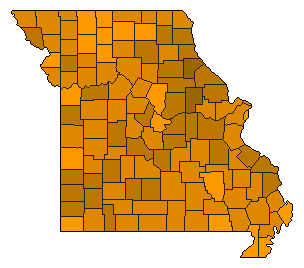
Map Key
| Turnout
 |  |  |
|
|
| | Election Information: | | Contest Type: | State-run Primary | | Election Date: | 2012-02-07 | | Eligible Participants: | Open (all voters) | | Delegates Awarded in this Contest: | 0 | | Delegates Total: | 52 | | Statewide Delegates: Advisory or non-binding primary - No delegates are awarded based on the results of this contest |
|
| Demographic Data
| 2012 Population: | 6,026,027 | Est. | 2012 Population Density: | 33.8 | persons/km2 | | 2010 Population: | 5,988,927 | Enum. | 2010 Population Density: | 33.6 | persons/km2 | | Total Delegates: | 52 | | Delegates Density: | 115,885 | persons/Del | | Land Area (2000): | 178,414 | km2 | Annual Pop Growth Rate: | 0.3 | % |
| Election Data and Statistics:
| Election Tools
|
| |
| |
Presidential
Candidate | Home State | Political
Party | Caucus Result | Delegates |
| Unallocated | - | Republican |
- |
- | 52 | 100.0% |
|
Map Key
| Turnout
|  |  |
| | Election Information: | | Contest Type: | Party-run Caucus/Convention | | Caucus Date: | 2012-03-17 | | Eligible Participants: | Open (all voters) | | Delegates Awarded in this Contest: | 49 | | Delegates Total: | 52 | | Statewide Delegates: Caucus and/or conventions - delegates are awarded through the Caucus and Convention system |
|
| Demographic Data
| 2012 Population: | 6,026,027 | Est. | 2012 Population Density: | 33.8 | persons/km2 | | 2010 Population: | 5,988,927 | Enum. | 2010 Population Density: | 33.6 | persons/km2 | | Total Delegates: | 52 | | Delegates Density: | 115,885 | persons/Del | | Land Area (2000): | 178,414 | km2 | Annual Pop Growth Rate: | 0.3 | % |
| Election Data and Statistics:
| Data Sources:
- Source for Popular Vote data:
- Source for Population data: U.S. Census Bureau.
|
| |
| |
Presidential
Candidate | Home State | Political
Party | County Convention
Vote | Delegates |
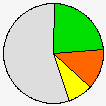
| Mitt Romney | Massachusetts | Republican |
0 |
0.00% | 12 | 23.1% |
| Rick Santorum | Virginia | Republican |
0 |
0.00% | 7 | 13.5% |
| Ron Paul | Texas | Republican |
0 |
0.00% | 4 | 7.7% |
| Newt Gingrich | Virginia | Republican |
0 |
0.00% | 1 | 1.9% |
| Unallocated | - | Republican |
- |
- | 28 | 53.8% |
|
Map Key
| Turnout
|  |  |
| | Election Information: | | Contest Type: | Party-run County Conventions | | Eligible Participants: | Closed (only members of the party) | | Delegates Awarded in this Contest: | 24 | | Delegates Total: | 52 | | Statewide Delegates: Caucus and/or conventions - delegates are awarded through the Caucus and Convention system |
|
| Demographic Data
| 2012 Population: | 6,026,027 | Est. | 2012 Population Density: | 33.8 | persons/km2 | | 2010 Population: | 5,988,927 | Enum. | 2010 Population Density: | 33.6 | persons/km2 | | Total Delegates: | 52 | | Delegates Density: | 115,885 | persons/Del | | Land Area (2000): | 178,414 | km2 | Annual Pop Growth Rate: | 0.3 | % |
| Election Data and Statistics:
| Data Sources:
- Source for Popular Vote data:
- Source for Population data: U.S. Census Bureau.
|
| |
|


