Home
2024
Election Results
Election Info
Weblog
Forum
Wiki
Search
Email
Login
Site Info
Store
1980 Attorney General General Election Results - Indiana
Note: The Google advertisement links below may advocate political positions that this site does not endorse.
Data for this Contest was Contributed by on 2016-10-18
Attorney General
Candidate
Political
Party
Popular Vote
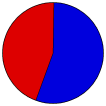
Linley Pearson
Republican
1,144,480
55.16%
Bob Webster
Democratic
930,440
44.84%
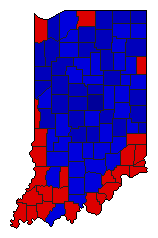
Map Key
> 40%
> 50%
> 60%
> 70%
Turnout
Maps
Pop. (m)
Demographic Data
1980 Population:
5,490,214
Enum.
1980 Population Density:
59.1
persons/km
2
1970 Population:
5,195,392
Enum.
1970 Population Density:
55.9
persons/km
2
Land Area (2000):
92,895
km
2
Annual Pop Growth Rate:
0.6
%
Election Data and Statistics:
County Data (Table)
(m)
County Data (Graphs)
Purchase Detailed Data
Compare State Data by Year (Table)
Compare State Data by Year (Graphs)
View All 1980 Indiana Data
Compare State Maps by Year
View All 1980 Indiana Maps
Election Tools
Atlas Forum
Image Code for Maps:
County
,
Pop
Data Sources:
Source for Popular Vote data: Indiana Secretary of Sate,
General Election Report of the Secretary of State of the State of Indiana 1980
(Indianapolis, 1980)
Source for Population data: U.S. Census Bureau.
Results for and Individual County:
(m)
Choose Year
2020
2016
2012
2008
2004
2000
1996
1992
1988
1984
1976
1972
1968
1924
Choose Office
President
Senator
Governor
Choose State
Missouri
North Dakota
Oregon
Pennsylvania
Rhode Island
Washington
Indiana Election Results Home
-
National Results for 1980
-
Use Frame Navigation
Login
Terms of Use
-
DCMA Policy
-
Privacy Policy and Cookies
©
Dave Leip's Atlas of U.S. Elections, LLC 2019 All Rights Reserved


