Home
2024
Election Results
Election Info
Weblog
Forum
Wiki
Search
Email
Login
Site Info
Store
1990 Gubernatorial Democratic Primary Election Results - Oklahoma
Note: The Google advertisement links below may advocate political positions that this site does not endorse.
Data for this Contest was Contributed by on 2014-07-10
Gubernatorial
Candidate
Political
Party
Popular Vote
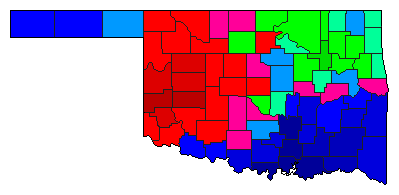
Wes Watkins
Democratic
175,568
32.33%
David Walters
Democratic
171,730
31.63%
Steve Lewis
Democratic
160,455
29.55%
John Shorty Barnett
Democratic
23,648
4.36%
Anne Hartin Langston
Democratic
11,605
2.14%
Map Key
> 30%
> 40%
> 50%
> 60%
> 70%
Turnout
Maps
Pop. (m)
Demographic Data
1990 Population:
3,145,576
Enum.
1990 Population Density:
17.7
persons/km
2
1980 Population:
3,025,487
Enum.
1980 Population Density:
17.0
persons/km
2
Land Area (2000):
177,847
km
2
Annual Pop Growth Rate:
0.4
%
Election Data and Statistics:
County Data (Table)
(m)
County Data (Graphs)
Purchase Detailed Data
Compare State Maps by Year
View All 1990 Oklahoma Maps
Election Tools
Atlas Forum
Image Code for Maps:
County
,
Pop
Data Sources:
Source for Popular Vote data: Oklahoma State Election Board.
Election Results & Statistics 1990
, Oklahoma State Election Board (http://digitalprairie.ok.gov/cdm/compoundobject/collection/stgovpub/id/9947/rec/15) (accessed 10 Jul 2014)
Source for Population data: U.S. Census Bureau.
Results for and Individual County:
(m)
Choose Year
2018
2010
2002
1998
1994
1986
1982
1978
Choose Office
Senator
Lt. Governor
State Treasurer
State Auditor
Choose State
Alabama
California
Florida
Georgia
Kansas
Maryland
Minnesota
Nebraska
New Mexico
Oregon
Texas
Oklahoma Election Results Home
-
National Results for 1990
-
Use Frame Navigation
Login
Terms of Use
-
DCMA Policy
-
Privacy Policy and Cookies
©
Dave Leip's Atlas of U.S. Elections, LLC 2019 All Rights Reserved


