Home
2024
Election Results
Election Info
Weblog
Forum
Wiki
Search
Email
Login
Site Info
Store
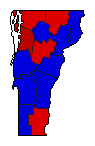
1978 Lt. Gubernatorial General Election Results - Vermont
Note: The Google advertisement links below may advocate political positions that this site does not endorse.
Data for this Contest was Contributed by on 2014-03-01
Lt. Gubernatorial
Candidate
Political
Party
Popular Vote
Madeleine M. Kunin
Democratic
62,372
50.63%
Peter P. Smith
Republican
58,171
47.22%
Dashiell Barney
Liberty Union
2,497
2.03%
Write-ins
-
151
0.12%
Map Key
> 40%
> 50%
> 60%
> 70%
Turnout
Maps
Pop. (m)
Election Notes:
Includes write-in votes not included in county-level data.
Demographic Data
1980 Population:
511,456
Enum.
1980 Population Density:
21.3
persons/km
2
1978 Population:
0
Est.
1978 Population Density:
0.0
persons/km
2
1970 Population:
444,732
Enum.
1970 Population Density:
18.6
persons/km
2
Land Area (2000):
23,956
km
2
Annual Pop Growth Rate:
1.4
%
Election Data and Statistics:
County Data (Table)
(m)
County Data (Graphs)
Purchase Detailed Data
Compare State Data by Year (Table)
Compare State Data by Year (Graphs)
View All 1978 Vermont Data
Compare State Maps by Year
View All 1978 Vermont Maps
Election Tools
Atlas Forum
Image Code for Maps:
County
,
Pop
Data Sources:
Source for Popular Vote data: Vermont Secretary of State.
Lieutenant Governor - 1978 General Election Results - Vermont
, Vermont Secretary of State (http://vermont-elections.org/elections1/1978GELtGov.pdf) (accessed 1 Mar 2014)
Source for Population data: U.S. Census Bureau.
Results for and Individual County:
(m)
Choose Year
2022
2020
2020
2018
2016
2014
2012
2010
2008
2006
2004
2002
2000
1998
1996
1986
1984
1982
1980
1976
1974
1970
1964
Choose Office
Governor
Choose State
California
Nebraska
Nevada
Oklahoma
Rhode Island
South Carolina
2020 >
Vermont Election Results Home
-
National Results for 1978
-
Use Frame Navigation
Login
Terms of Use
-
DCMA Policy
-
Privacy Policy and Cookies
©
Dave Leip's Atlas of U.S. Elections, LLC 2019 All Rights Reserved


