Home
2024
Election Results
Election Info
Weblog
Forum
Wiki
Search
Email
Login
Site Info
Store
1992 Gubernatorial Open Primary Election Results - Washington
Note: The Google advertisement links below may advocate political positions that this site does not endorse.
Data for this Contest was Contributed by on 2007-01-21
Gubernatorial
Candidate
Political
Party
Popular Vote
Mike Lowry
Democratic
337,783
29.23%
Ken Eikenberry
Republican
258,553
22.37%
Sid Morrison
Republican
250,418
21.67%
Dan McDonald
Republican
144,050
12.47%
Joe King
Democratic
96,480
8.35%
Sally McQuown
Democratic
31,175
2.70%
Richard B. "Ornery Dick" Short
Democratic
8,470
0.73%
Bob Tharp
Republican
8,103
0.70%
Wayne Madsen
Democratic
7,860
0.68%
Mike The Mover
Independent
6,645
0.58%
Kathleen Wheeler
Socialist Workers
6,068
0.53%
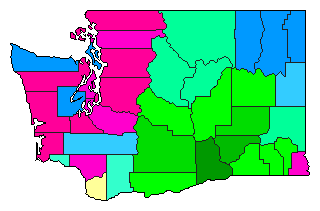
Map Key
> 20%
> 30%
> 40%
> 50%
> 60%
> 70%
Turnout
Maps
Pop. (m)
Demographic Data
2000 Population:
5,894,121
Enum.
2000 Population Density:
34.2
persons/km
2
1992 Population:
5,160,757
Est.
1992 Population Density:
29.9
persons/km
2
1990 Population:
4,866,669
Enum.
1990 Population Density:
28.2
persons/km
2
Land Area (2000):
172,348
km
2
Annual Pop Growth Rate:
1.9
%
Election Data and Statistics:
County Data (Table)
(m)
County Data (Graphs)
Purchase Detailed Data
Compare State Maps by Year
View All 1992 Washington Maps
Election Tools
Atlas Forum
Image Code for Maps:
County
,
Pop
Data Sources:
Source for Popular Vote data: Washington Secretary of State.
September 1992 Primary
, Washington Secretary of State (http://secstate.wa.gov/elections/results_report.aspx?e=45&c=&c2=&t=&t2=&p=&p2=&y=) (accessed 21 Jan 2007)
Source for Population data: U.S. Census Bureau.
Results for and Individual County:
(m)
Choose Year
2000
1996
1988
1984
1980
1976
1972
1968
Choose Office
Senator
Choose State
Washington Election Results Home
-
National Results for 1992
-
Use Frame Navigation
Login
Terms of Use
-
DCMA Policy
-
Privacy Policy and Cookies
©
Dave Leip's Atlas of U.S. Elections, LLC 2019 All Rights Reserved


