| |
Presidential
Candidate | Vice Presidential
Candidate | Political
Party | Popular Vote | Electoral Vote |
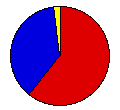
 | Barack H. Obama | Joseph R. Biden, Jr. | Democratic |
8,274,473 |
60.92% | 55 |
 | John S. McCain, III | Sarah Palin | Republican |
5,011,781 |
36.90% | 0 |
 | Ralph Nader | Matt Gonzalez | Peace and Freedom |
108,381 |
0.80% | 0 |
| Bob Barr | Wayne A. Root | Libertarian |
67,582 |
0.50% | 0 |
| Alan Keyes | Wiley S. Drake, Sr. | American Independent |
40,673 |
0.30% | 0 |
| Cynthia A. McKinney | Rosa A. Clemente | Green |
38,774 |
0.29% | 0 |
| Other (+) | - | - |
41,419 |
0.30% | 0 |
 |
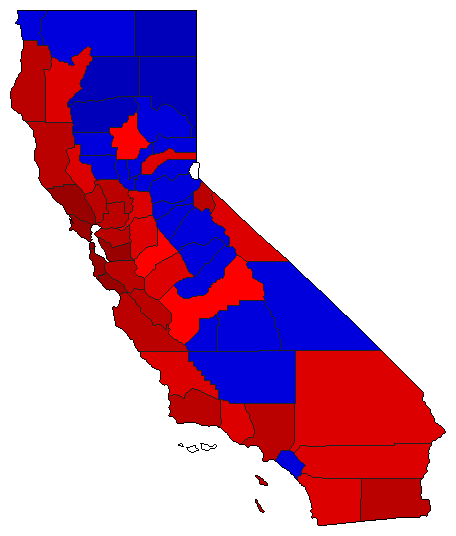
Map Key
| > 40% |
 |
 |
| > 50% |
 |
 |
| > 60% |
 |
 |
| > 70% |
 |
|
| > 80% |
 |
|
| Turnout
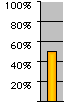 |  |  |
|
|
| Election Notes:
- The Statement of Vote does not count any write-in votes for candidates that did not register for qualified write-in status. Officially, Frank Moore received 36 write-in votes. The write-ins votes listed here were collected from each county election agency (incomplete data).
- James Harris appeared as a qualified write-in candidate as a stand-in candidate for Róger Calero
| Demographic Data
| 2010 Population: | 37,253,956 | Enum. | 2010 Population Density: | 92.2 | persons/km2 | | 2008 Population: | 36,604,337 | Est. | 2008 Population Density: | 90.6 | persons/km2 | | 2000 Population: | 33,871,648 | Enum. | 2000 Population Density: | 83.9 | persons/km2 | | Total Electoral Vote: | 55 | | Electoral Vote Density: | 665,533 | persons/EV | | Land Area (2000): | 403,933 | km2 | Annual Pop Growth Rate: | 1.0 | % |
| Election Data and Statistics:
| Election Tools
- Atlas Forum Image Code for Maps: County, CD, Pop, Tnd, Swg
Data Sources:
- Source for Popular Vote data: California Secretary of State, "President," Statement of Vote November 4, 2008, General Election (Sacramento, 2008)
- Source for Population data: U.S. Census Bureau.
| Results for and Individual County:
| | Primary Documentation:
|
| The 2008 Campaign:
|
|
| |
|


