Note: The Google advertisement links below may advocate political positions that this site does not endorse.
Data for this Contest was Contributed by on 2018-12-31
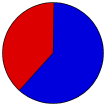
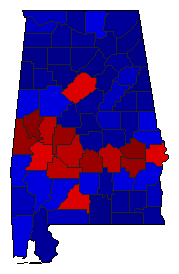
  Lt. Gubernatorial
Candidate
Political
Party
Popular Vote
Will AinsworthRepublican 1,044,941 61.25%
Will BoydDemocratic 660,013 38.69%
Write-ins- 1,023 0.06%
State Seal Map Key
 > 50%
 > 60%
 > 70%
 > 80%
Turnout
Voter Turnout Graph
Vote Pie Chart
Maps
  2018 Alabama County Map of General Election Results for Lt. Governor  
County Button
Pop Button
Per Vote Republican Button
Per Vote Democratic Button
 
Election Data and Statistics:
Election Tools
Data Sources:
  • Source for Popular Vote data: Alabama Secretary of State. Canvass of Results, Alabama Secretary of State (https://www.sos.alabama.gov/sites/default/files/voter-pdfs/2018/2018-Official-General-Election-Results-Certified-2018-11) (accessed 31 Dec 2018)
  • Source for Population data: U.S. Census Bureau.
Results for and Individual County:


Autauga County Baldwin County Barbour County Bibb County Blount County Bullock County Butler County Calhoun County Chambers County Cherokee County Chilton County Choctaw County Clarke County Clay County Cleburne County Coffee County Colbert County Conecuh County Coosa County Covington County Crenshaw County Cullman County Dale County Dallas County DeKalb County Elmore County Escambia County Etowah County Fayette County Franklin County Geneva County Greene County Hale County Henry County Houston County Jackson County Jefferson County Lamar County Lauderdale County Lawrence County Lee County Limestone County Lowndes County Macon County Madison County Marengo County Marion County Marshall County Mobile County Monroe County Montgomery County Morgan County Perry County Pickens County Pike County Randolph County Russell County St. Clair County Shelby County Sumter County Talladega County Tallapoosa County Tuscaloosa County Walker County Washington County Wilcox County Winston County