Home
2024
Election Results
Election Info
Weblog
Forum
Wiki
Search
Email
Login
Site Info
Store
2022 Attorney General General Election Results
Note: The Google advertisement links below may advocate political positions that this site does not endorse.
Attorney General
Candidate
Political
Party
Popular Vote
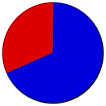
Steve Marshall
AL Republican
955,425
67.90%
Wendell Major
AL Democratic
450,543
32.02%
Write-ins
-
1,220
0.09%
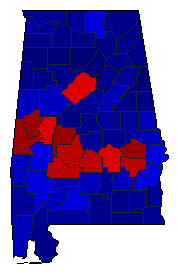
Map Key
> 50%
> 60%
> 70%
> 80%
> 90%
Turnout
Maps
Election Data and Statistics:
County Data (Table)
(m)
County Data (Graphs)
Purchase Detailed Data
Compare State Data by Year (Table)
Compare State Data by Year (Graphs)
View All 2022 Alabama Data
Compare State Maps by Year
View All 2022 Alabama Maps
Election Tools
Atlas Forum
Image Code for Maps:
County
Data Sources:
Source for Popular Vote data:
Source for Population data: U.S. Census Bureau.
Results for and Individual County:
Autauga County
Baldwin County
Barbour County
Bibb County
Blount County
Bullock County
Butler County
Calhoun County
Chambers County
Cherokee County
Chilton County
Choctaw County
Clarke County
Clay County
Cleburne County
Coffee County
Colbert County
Conecuh County
Coosa County
Covington County
Crenshaw County
Cullman County
Dale County
Dallas County
DeKalb County
Elmore County
Escambia County
Etowah County
Fayette County
Franklin County
Geneva County
Greene County
Hale County
Henry County
Houston County
Jackson County
Jefferson County
Lamar County
Lauderdale County
Lawrence County
Lee County
Limestone County
Lowndes County
Macon County
Madison County
Marengo County
Marion County
Marshall County
Mobile County
Monroe County
Montgomery County
Morgan County
Perry County
Pickens County
Pike County
Randolph County
Russell County
St. Clair County
Shelby County
Sumter County
Talladega County
Tallapoosa County
Tuscaloosa County
Walker County
Washington County
Wilcox County
Winston County
Choose Year
2018
2014
2010
2006
2002
1998
1994
1990
Choose Office
Senator
Governor
Lt. Governor
Secretary of State
State Treasurer
State Auditor
Agriculture Commissioner
Choose State
Arizona
Arkansas
Colorado
Connecticut
Delaware
Florida
Georgia
Idaho
Illinois
Iowa
Kansas
Maryland
Massachusetts
Michigan
Minnesota
Nebraska
Nevada
New Mexico
New York
North Dakota
Ohio
Oklahoma
Rhode Island
South Carolina
South Dakota
Texas
Vermont
Wisconsin
California
Alabama Election Results Home
-
National Results for 2022
-
Use Frame Navigation
View Large Map Page for This Contest
Login
Terms of Use
-
DCMA Policy
-
Privacy Policy and Cookies
©
Dave Leip's Atlas of U.S. Elections, LLC 2019 All Rights Reserved


