Home
2024
Election Results
Election Info
Weblog
Forum
Wiki
Search
Email
Login
Site Info
Store
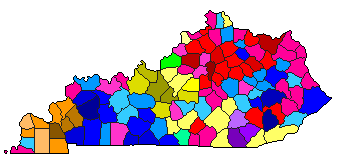
1979 Lt. Gubernatorial Democratic Primary Election Results - Kentucky
Note: The Google advertisement links below may advocate political positions that this site does not endorse.
Data for this Contest was Contributed by on 2009-03-08
Lt. Gubernatorial
Candidate
Political
Party
Popular Vote
Martha Layne Collins
Democratic
109,031
23.15%
William M. (Bill) Cox
Democratic
105,693
22.44%
Todd Hollenbach
Democratic
96,019
20.39%
Joe Prather
Democratic
91,583
19.45%
Richard H. Lewis
Democratic
42,533
9.03%
Jim Vernon
Democratic
19,122
4.06%
Charley T. Rowland
Democratic
6,944
1.47%
Map Key
> 20%
> 30%
> 40%
> 50%
> 60%
> 70%
Turnout
Maps
Pop. (m)
Demographic Data
1980 Population:
3,660,324
Enum.
1980 Population Density:
35.6
persons/km
2
1979 Population:
0
Est.
1979 Population Density:
0.0
persons/km
2
1970 Population:
3,220,711
Enum.
1970 Population Density:
31.3
persons/km
2
Land Area (2000):
102,896
km
2
Annual Pop Growth Rate:
1.3
%
Election Data and Statistics:
County Data (Table)
(m)
County Data (Graphs)
Purchase Detailed Data
Compare State Maps by Year
View All 1979 Kentucky Maps
Election Tools
Atlas Forum
Image Code for Maps:
County
,
Pop
Data Sources:
Source for Popular Vote data: Kentucky State Board of Elections.
Primary Elections, May 29, 1979
, Kentucky State Board of Elections (http://elect.ky.gov/NR/rdonlyres/50D4171E-47AA-4D78-BAE6-1846546C15A4/0/gov_ltgov.txt) (accessed 07 Mar 2007)
Source for Population data: U.S. Census Bureau.
Results for and Individual County:
(m)
Choose Year
1991
1987
1983
1975
Choose Office
Governor
Secretary of State
State Auditor
Agriculture Commissioner
Choose State
Kentucky Election Results Home
-
National Results for 1979
-
Use Frame Navigation
Login
Terms of Use
-
DCMA Policy
-
Privacy Policy and Cookies
©
Dave Leip's Atlas of U.S. Elections, LLC 2019 All Rights Reserved


