Home
2024
Election Results
Election Info
Weblog
Forum
Wiki
Search
Email
Login
Site Info
Store
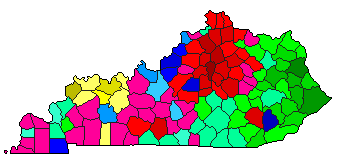
1987 Lt. Gubernatorial Democratic Primary Election Results - Kentucky
Note: The Google advertisement links below may advocate political positions that this site does not endorse.
Data for this Contest was Contributed by on 2007-02-11
Lt. Gubernatorial
Candidate
Political
Party
Popular Vote
Brereton Jones
Democratic
189,058
33.16%
Dave Armstrong
Democratic
147,718
25.91%
Paul Patton
Democratic
130,713
22.92%
David E. Boswell
Democratic
57,209
10.03%
Alace McDonald
Democratic
41,520
7.28%
Wilton Benge Cupp
Democratic
3,987
0.70%
Map Key
> 20%
> 30%
> 40%
> 50%
> 60%
> 70%
> 80%
Turnout
Maps
Pop. (m)
Demographic Data
1990 Population:
3,686,892
Enum.
1990 Population Density:
35.8
persons/km
2
1987 Population:
0
Est.
1987 Population Density:
0.0
persons/km
2
1980 Population:
3,660,324
Enum.
1980 Population Density:
35.6
persons/km
2
Land Area (2000):
102,896
km
2
Annual Pop Growth Rate:
0.1
%
Election Data and Statistics:
County Data (Table)
(m)
County Data (Graphs)
Purchase Detailed Data
Compare State Maps by Year
View All 1987 Kentucky Maps
Election Tools
Atlas Forum
Image Code for Maps:
County
,
Pop
Data Sources:
Source for Popular Vote data: Kentucky State Board of Elections.
Primary Election
, Kentucky State Board of Elections (http://elect.ky.gov/NR/rdonlyres/7D1CF89B-6C73-4FB4-ACC0-19FAB8D41BC5/6268/res_govltgov1.txt) (accessed 11 Feb 2007)
Source for Population data: U.S. Census Bureau.
Results for and Individual County:
(m)
Choose Year
1991
1983
1979
1975
Choose Office
Governor
Secretary of State
State Treasurer
Attorney General
State Auditor
Agriculture Commissioner
Choose State
Kentucky Election Results Home
-
National Results for 1987
-
Use Frame Navigation
Login
Terms of Use
-
DCMA Policy
-
Privacy Policy and Cookies
©
Dave Leip's Atlas of U.S. Elections, LLC 2019 All Rights Reserved


