Home
2024
Election Results
Election Info
Weblog
Forum
Wiki
Search
Email
Login
Site Info
Store
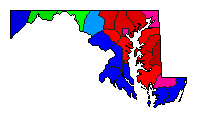
1978 Gubernatorial Democratic Primary Election Results - Maryland
Note: The Google advertisement links below may advocate political positions that this site does not endorse.
Data for this Contest was Contributed by on 2007-05-03
Gubernatorial
Candidate
Political
Party
Popular Vote
Harry Hughes
Democratic
213,457
37.23%
Blair Lee
Democratic
194,236
33.88%
Theodore G. Venetoulis
Democratic
140,486
24.50%
Walter S. Orlinsky
Democratic
25,200
4.39%
Map Key
> 30%
> 40%
> 50%
> 60%
Turnout
Maps
Pop. (m)
Demographic Data
1980 Population:
4,216,933
Enum.
1980 Population Density:
166.6
persons/km
2
1978 Population:
0
Est.
1978 Population Density:
0.0
persons/km
2
1970 Population:
3,923,897
Enum.
1970 Population Density:
155.0
persons/km
2
Land Area (2000):
25,314
km
2
Annual Pop Growth Rate:
0.7
%
Election Data and Statistics:
County Data (Table)
(m)
County Data (Graphs)
Purchase Detailed Data
Compare State Maps by Year
View All 1978 Maryland Maps
Election Tools
Atlas Forum
Image Code for Maps:
County
,
Pop
Data Sources:
Source for Popular Vote data: Archives of Maryland.
Maryland Manual, 1979-1980
, Archives of Maryland (http://aomol.net/megafile/msa/speccol/sc2900/sc2908/000001/000179/pdf/am179--639.pdf) (accessed 03 May 2007)
Source for Population data: U.S. Census Bureau.
Results for and Individual County:
(m)
Choose Year
2022
2018
1994
1990
1986
1966
Choose Office
Choose State
Alabama
Arkansas
Florida
Illinois
Massachusetts
Minnesota
Nevada
Oklahoma
Oregon
Maryland Election Results Home
-
National Results for 1978
-
Use Frame Navigation
Login
Terms of Use
-
DCMA Policy
-
Privacy Policy and Cookies
©
Dave Leip's Atlas of U.S. Elections, LLC 2019 All Rights Reserved


