Home
2024
Election Results
Election Info
Weblog
Forum
Wiki
Search
Email
Login
Site Info
Store
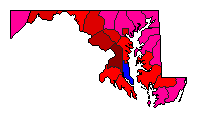
1994 Gubernatorial Democratic Primary Election Results - Maryland
Note: The Google advertisement links below may advocate political positions that this site does not endorse.
Data for this Contest was Contributed by on 2007-02-07
Gubernatorial
Candidate
Political
Party
Popular Vote
Parris N. Glendening
Democratic
293,314
53.58%
American Joe Miedusiewski
Democratic
100,326
18.33%
Melvin A. Steinberg
Democratic
82,308
15.04%
Mary Boergers
Democratic
46,888
8.57%
Don Allensworth
Democratic
15,680
2.86%
Walter Gilcrist Finch
Democratic
5,369
0.98%
Lawrence K. Freeman
Democratic
3,518
0.64%
Map Key
> 30%
> 40%
> 50%
> 60%
> 80%
Turnout
Maps
Pop. (m)
Demographic Data
2000 Population:
5,296,486
Enum.
2000 Population Density:
209.2
persons/km
2
1994 Population:
5,023,060
Est.
1994 Population Density:
198.4
persons/km
2
1990 Population:
4,780,753
Enum.
1990 Population Density:
188.9
persons/km
2
Land Area (2000):
25,314
km
2
Annual Pop Growth Rate:
1.0
%
Election Data and Statistics:
County Data (Table)
(m)
County Data (Graphs)
Purchase Detailed Data
Compare State Maps by Year
View All 1994 Maryland Maps
Election Tools
Atlas Forum
Image Code for Maps:
County
,
Pop
Data Sources:
Source for Popular Vote data: Maryland Secretary of State.
1994 Gubernatorial Primary Election Results
, Maryland Secretary of State (http://www.elections.state.md.us/elections/1994/results_1994/pagov.html) (accessed 07 Feb 2007)
Source for Population data: U.S. Census Bureau.
Results for and Individual County:
(m)
Choose Year
2022
2018
1990
1986
1978
1966
Choose Office
Choose State
Alabama
Arizona
California
Florida
Georgia
Idaho
Illinois
Iowa
Kansas
Maine
Minnesota
Nebraska
Oklahoma
Oregon
South Carolina
Texas
Maryland Election Results Home
-
National Results for 1994
-
Use Frame Navigation
Login
Terms of Use
-
DCMA Policy
-
Privacy Policy and Cookies
©
Dave Leip's Atlas of U.S. Elections, LLC 2019 All Rights Reserved


