Home
2024
Election Results
Election Info
Weblog
Forum
Wiki
Search
Email
Login
Site Info
Store
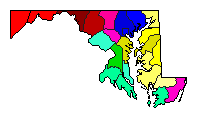
1998 Comptroller General Republican Primary Election Results - Maryland
Note: The Google advertisement links below may advocate political positions that this site does not endorse.
Data for this Contest was Contributed by on 2007-03-31
Comptroller General
Candidate
Political
Party
Popular Vote
Larry Mark Epstein
Republican
42,488
23.37%
Timothy R. Mayberry
Republican
42,480
23.36%
Michael Steele
Republican
37,726
20.75%
Ardath M. Cade
Republican
32,102
17.66%
Robert W. Kearns
Republican
17,321
9.53%
Eugene Robert Zarwell
Republican
9,706
5.34%
Map Key
> 20%
> 30%
> 40%
> 50%
> 60%
> 80%
Turnout
Maps
Pop. (m)
Demographic Data
2000 Population:
5,296,486
Enum.
2000 Population Density:
209.2
persons/km
2
1998 Population:
5,204,464
Est.
1998 Population Density:
205.6
persons/km
2
1990 Population:
4,780,753
Enum.
1990 Population Density:
188.9
persons/km
2
Land Area (2000):
25,314
km
2
Annual Pop Growth Rate:
1.0
%
Election Data and Statistics:
County Data (Table)
(m)
County Data (Graphs)
Purchase Detailed Data
Compare State Maps by Year
View All 1998 Maryland Maps
Election Tools
Atlas Forum
Image Code for Maps:
County
,
Pop
Data Sources:
Source for Popular Vote data: Maryland Secretary of State.
1998 Gubernatorial Primary Election Results
, Maryland Secretary of State (http://www.elections.state.md.us/elections/1998/results_1998/pacmp.html) (accessed 31 Mar 2007)
Source for Population data: U.S. Census Bureau.
Results for and Individual County:
(m)
Choose Year
2014
2010
Choose Office
Choose State
Illinois
Maryland Election Results Home
-
National Results for 1998
-
Use Frame Navigation
Login
Terms of Use
-
DCMA Policy
-
Privacy Policy and Cookies
©
Dave Leip's Atlas of U.S. Elections, LLC 2019 All Rights Reserved


