Home
2024
Election Results
Election Info
Weblog
Forum
Wiki
Search
Email
Login
Site Info
Store
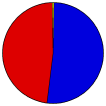
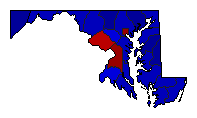
2002 Gubernatorial General Election Results - Maryland
Note: The Google advertisement links below may advocate political positions that this site does not endorse.
Gubernatorial
Candidate
Lt. Gubernatorial
Candidate
Political
Party
Popular Vote
Robert Ehrlich Jr.
Michael Steele
Republican
879,592
51.55%
Kathleen Townsend
Charles Larson
Democratic
813,422
47.68%
Spear Lancaster
Lorenzo Gaztanaga
Libertarian
11,546
0.68%
Write-ins
-
Write-ins
1,619
0.09%
Map Key
> 40%
> 50%
> 60%
> 70%
Turnout
Maps
Demographic Data
2010 Population:
5,773,552
Enum.
2010 Population Density:
228.1
persons/km
2
2002 Population:
5,440,389
Est.
2002 Population Density:
214.9
persons/km
2
2000 Population:
5,296,486
Enum.
2000 Population Density:
209.2
persons/km
2
Land Area (2000):
25,314
km
2
Annual Pop Growth Rate:
0.9
%
Election Data and Statistics:
County Data (Table)
(m)
County Data (Graphs)
Purchase Detailed Data
Compare State Data by Year (Table)
Compare State Data by Year (Graphs)
View All 2002 Maryland Data
Compare State Maps by Year
View All 2002 Maryland Maps
Election Tools
Atlas Forum
Image Code for Maps:
County
,
Pop
,
Tnd
,
Swg
Data Sources:
Source for Popular Vote data: Maryland State Board of Elections.
2002 Gubernatorial General - Official Results
, Maryland State Board of Elections ( ) (accessed 15 Jun 2006)
Source for Population data: U.S. Census Bureau.
Results for and Individual County:
Allegany County
Anne Arundel County
Baltimore County
Calvert County
Caroline County
Carroll County
Cecil County
Charles County
Dorchester County
Frederick County
Garrett County
Harford County
Howard County
Kent County
Montgomery County
Prince George's County
Queen Anne's County
St. Mary's County
Somerset County
Talbot County
Washington County
Wicomico County
Worcester County
Baltimore City
< 1998
Choose Year
2022
2018
2014
2010
2006
1998
1994
1990
1986
1982
1978
1974
1970
1966
1962
1958
1954
1950
1946
1942
1938
1934
1930
1926
1923
1919
1915
1899
Choose Office
Attorney General
Comptroller General
Choose State
Alabama
Alaska
Arizona
Arkansas
California
Colorado
Connecticut
Florida
Georgia
Hawaii
Idaho
Illinois
Iowa
Kansas
Maine
Massachusetts
Michigan
Minnesota
Nebraska
Nevada
New Hampshire
New Mexico
New York
Ohio
Oklahoma
Oregon
Pennsylvania
Rhode Island
South Carolina
South Dakota
Tennessee
Texas
Vermont
Wisconsin
Wyoming
2006 >
Maryland Election Results Home
-
National Results for 2002
-
Use Frame Navigation
Login
Terms of Use
-
DCMA Policy
-
Privacy Policy and Cookies
©
Dave Leip's Atlas of U.S. Elections, LLC 2019 All Rights Reserved


