Home
2024
Election Results
Election Info
Weblog
Forum
Wiki
Search
Email
Login
Site Info
Store
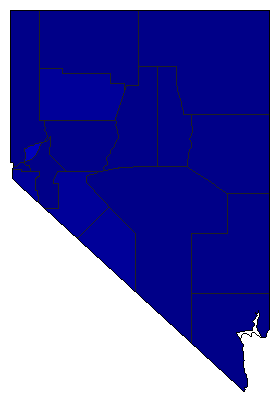
1978 Gubernatorial Republican Primary Election Results - Nevada
Note: The Google advertisement links below may advocate political positions that this site does not endorse.
Data for this Contest was Contributed by on 2014-08-13
Gubernatorial
Candidate
Political
Party
Popular Vote
Robert List
Republican
39,997
82.35%
None of these candidates
Republican
3,570
7.35%
William C. Allen
Republican
3,038
6.26%
Patrick T. Mylan
Republican
1,360
2.80%
Fred N. Belcher
Republican
602
1.24%
Map Key
> 50%
> 60%
> 70%
> 80%
Turnout
Maps
Pop. (m)
Demographic Data
1980 Population:
800,508
Enum.
1980 Population Density:
2.8
persons/km
2
1978 Population:
0
Est.
1978 Population Density:
0.0
persons/km
2
1970 Population:
488,738
Enum.
1970 Population Density:
1.7
persons/km
2
Land Area (2000):
284,448
km
2
Annual Pop Growth Rate:
5.1
%
Election Data and Statistics:
County Data (Table)
(m)
County Data (Graphs)
Purchase Detailed Data
Compare State Maps by Year
View All 1978 Nevada Maps
Election Tools
Atlas Forum
Image Code for Maps:
County
,
Pop
Data Sources:
Source for Popular Vote data: NV Secretary of State.
Summary of Vote in Primary Election Held September 12, 1978
, NV Secretary of State (http://nvsos.gov/Modules/ShowDocument.aspx?documentid=3140) (accessed 10 Aug 2014)
Source for Population data: U.S. Census Bureau.
Results for and Individual County:
(m)
Choose Year
2022
2018
2010
2006
1998
1974
1970
1966
1962
1930
1922
1918
Choose Office
Lt. Governor
Secretary of State
State Treasurer
Choose State
Florida
Oklahoma
Oregon
Wisconsin
Nevada Election Results Home
-
National Results for 1978
-
Use Frame Navigation
Login
Terms of Use
-
DCMA Policy
-
Privacy Policy and Cookies
©
Dave Leip's Atlas of U.S. Elections, LLC 2019 All Rights Reserved


