Note: The Google advertisement links below may advocate political positions that this site does not endorse.
Data for this Contest was Contributed by on 2018-06-07
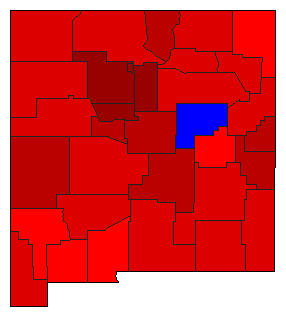
* Unofficial Results *

  Gubernatorial
Candidate
Political
Party
Popular Vote
Michelle Lujan GrishamDemocratic 116,354 66.39%
Jeff ApodacaDemocratic 38,812 22.14%
Joseph CervantesDemocratic 20,103 11.47%
State Seal Map Key
 > 40%
 > 50%
 > 60%
 > 70%
Turnout
Voter Turnout Graph
Vote Pie Chart
Maps
  2018 New Mexico County Map of Democratic Primary Election Results for Governor  
County Button
Pop Button
Per Vote Democratic Button
 
Election Data and Statistics:
Election Tools
Data Sources:
  • Source for Popular Vote data: New Mexico Secretary of State. Unofficial Results: Primary Election - June 5, 2018, New Mexico Secretary of State (http://electionresults.sos.state.nm.us/resultsCTY.aspx?type=SW&rid=4510&pty=DEM&osn=200&map=CTY) (accessed 07 Jun 2018)
  • Source for Population data: U.S. Census Bureau.
Results for and Individual County:


Bernalillo County Catron County Chaves County Cibola County Colfax County Curry County De Baca County Dona Ana County Eddy County Grant County Guadalupe County Harding County Hidalgo County Lea County Lincoln County Los Alamos County Luna County McKinley County Mora County Otero County Quay County Rio Arriba County Roosevelt County Sandoval County San Juan County San Miguel County Santa Fe County Sierra County Socorro County Taos County Torrance County Union County Valencia County