Home
2024
Election Results
Election Info
Weblog
Forum
Wiki
Search
Email
Login
Site Info
Store
2018 Senatorial General Election Results
Note: The Google advertisement links below may advocate political positions that this site does not endorse.
Senatorial
Candidate
Political
Party
Popular Vote
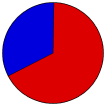
Kirsten E. Gillibrand
Democratic
4,056,931
66.96%
Chele Chiavacci Farley
Republican
1,998,220
32.98%
Write-ins
Write-in
3,872
0.06%
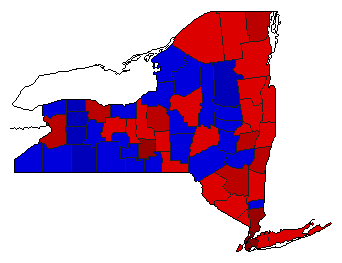
Map Key
> 50%
> 60%
> 70%
> 80%
> 90%
Turnout
Maps
Election Data and Statistics:
County Data (Table)
(m)
County Data (Graphs)
Purchase Detailed Data
Compare State Data by Year (Table)
Compare State Data by Year (Graphs)
View All 2018 New York Data
Compare State Maps by Year
View All 2018 New York Maps
Election Tools
Atlas Forum
Image Code for Maps:
County
,
Pop
,
Tnd
,
Swg
Data Sources:
Source for Popular Vote data: New York State Board of Elections,
Certified Results from the November 6, 2018 General Election for U.S. Senator
(Albany, 2018)
Source for Population data: U.S. Census Bureau.
Results for and Individual County:
Albany County
Allegany County
Bronx County
Broome County
Cattaraugus County
Cayuga County
Chautauqua County
Chemung County
Chenango County
Clinton County
Columbia County
Cortland County
Delaware County
Dutchess County
Erie County
Essex County
Franklin County
Fulton County
Genesee County
Greene County
Hamilton County
Herkimer County
Jefferson County
Kings County
Lewis County
Livingston County
Madison County
Monroe County
Montgomery County
Nassau County
New York County
Niagara County
Oneida County
Onondaga County
Ontario County
Orange County
Orleans County
Oswego County
Otsego County
Putnam County
Queens County
Rensselaer County
Richmond County
Rockland County
St. Lawrence County
Saratoga County
Schenectady County
Schoharie County
Schuyler County
Seneca County
Steuben County
Suffolk County
Sullivan County
Tioga County
Tompkins County
Ulster County
Warren County
Washington County
Wayne County
Westchester County
Wyoming County
Yates County
The 2018 Campaign:
Pre-Election Polls
< 2016
Choose Year
2022
2016
2012
2010
2010
2006
2004
2000
1998
1994
1992
1988
1982
1976
1970
1968
1964
1962
1946
Choose Office
Governor
Attorney General
Comptroller General
Choose State
Arizona Class 1
California Class 1
Connecticut Class 1
Delaware Class 1
Florida Class 1
Hawaii Class 1
Indiana Class 1
Maine Class 1
Maryland Class 1
Massachusetts Class 1
Michigan Class 1
Minnesota Class 1
Minnesota Class 2
Mississippi Class 1
Mississippi Class 2
Missouri Class 1
Montana Class 1
Nebraska Class 1
Nevada Class 1
New Jersey Class 1
New Mexico Class 1
North Dakota Class 1
Ohio Class 1
Pennsylvania Class 1
Rhode Island Class 1
Tennessee Class 1
Texas Class 1
Utah Class 1
Vermont Class 1
Virginia Class 1
Washington Class 1
West Virginia Class 1
Wisconsin Class 1
Wyoming Class 1
2022 >
New York Election Results Home
-
National Results for 2018
-
Use Frame Navigation
View Large Map Page for This Contest
Login
Terms of Use
-
DCMA Policy
-
Privacy Policy and Cookies
©
Dave Leip's Atlas of U.S. Elections, LLC 2019 All Rights Reserved


