Home
2024
Election Results
Election Info
Weblog
Forum
Wiki
Search
Email
Login
Site Info
Store
1990 Gubernatorial General Election Results - Oregon
Note: The Google advertisement links below may advocate political positions that this site does not endorse.
Gubernatorial
Candidate
Political
Party
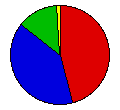
Popular Vote
Barbara Roberts
Democratic
508,749
45.72%
Dave Frohnmayer
Republican
444,646
39.96%
Al Mobley
Independent
144,062
12.95%
Fred Oerther
Libertarian
14,583
1.31%
Write-ins
-
807
0.07%
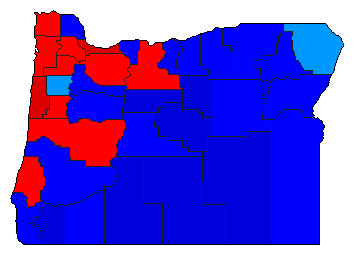
Map Key
> 30%
> 40%
> 50%
> 60%
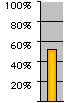
Turnout
Maps
Pop. (m)
Dem. (m)
Rep. (m)
Ind. (m)
Demographic Data
1990 Population:
2,842,337
Enum.
1990 Population Density:
11.4
persons/km
2
1980 Population:
2,633,156
Enum.
1980 Population Density:
10.6
persons/km
2
Land Area (2000):
248,631
km
2
Annual Pop Growth Rate:
0.8
%
Election Data and Statistics:
County Data (Table)
(m)
County Data (Graphs)
Purchase Detailed Data
Compare State Data by Year (Table)
Compare State Data by Year (Graphs)
View All 1990 Oregon Data
Compare State Maps by Year
View All 1990 Oregon Maps
Election Tools
Atlas Forum
Image Code for Maps:
County
,
Pop
Data Sources:
Source for Popular Vote data: Oregon Secretary of State. Elections Division, "Governor,"
Official Abstract of Votes General Election November 6, 1990
(Salem, 1990)
Source for Population data: U.S. Census Bureau.
Results for and Individual County:
(m)
Choose Year
2022
2018
2016
2014
2010
2006
2002
1998
1994
1986
1982
1978
1974
1970
1966
1962
1958
1956
1954
1950
1946
1942
1938
1934
1930
1926
1922
1918
1914
1910
1906
1902
1898
1894
1890
1886
1882
1878
1874
1870
1866
Choose Office
Senator
Choose State
Alabama
Alaska
Arizona
Arkansas
California
Colorado
Connecticut
Florida
Georgia
Hawaii
Idaho
Illinois
Iowa
Kansas
Maine
Maryland
Massachusetts
Michigan
Minnesota
Nebraska
Nevada
New Hampshire
New Mexico
New York
Ohio
Oklahoma
Pennsylvania
Rhode Island
South Carolina
South Dakota
Tennessee
Texas
Vermont
Wisconsin
Wyoming
1994 >
Oregon Election Results Home
-
National Results for 1990
-
Use Frame Navigation
Login
Terms of Use
-
DCMA Policy
-
Privacy Policy and Cookies
©
Dave Leip's Atlas of U.S. Elections, LLC 2019 All Rights Reserved


